Chapter 8
Conducted Emission[edit]
Introduction[edit]
The conducted emission measurements can be performed with a Line Impedance Stabilisation Network (L.I.S.N.) on power supply cables, or with an absorbing clamp, on power supply cables and/or I/O cables). Automotive standards use a Line Impedance Stabilisation Network to measure the conducted emission on 12V and 24V board voltages.
RadiMation® supports the use of 1, 2, 3 and 4 phase, Line Impedance Stabilisation networks. Generally 1 phase LISN’s are used for measurements on DC lines, as is the case during automotive measurements. 2 phase LISN’s are normally used to measure conducted emission on single-phase mains supplies (in this case the emission on Phase and Neutral are measured separately). 3 and 4 phase LISN’s are used to measured conducted emissions on 3 phase mains supplies (in this case the emission on L1, L2, L3 and, if applicable, N are measured).
Conducted emission tests can either be performed with a measurement receiver, or a spectrum analyser. For full compliant conduced emission tests, the measurement receiver, or spectrum analyser must be CISPR 16-1 compliant. This standard describes the dynamic range, input, sensitivity, needed filters and accuracy of the measuring device.
| Warning: | Extreme care should be taken when the LISN measuring output is switched from one phase to the other. The measurement output of the LISN is capacitive coupled to the mains line and therefore switching between Phase and Neutral will cause a voltage transient of 310 V at the input of the receiver. When no extra protection is used, this transient can easily destroy the mixer diode(s) of the measuring device.
We recommend to use a transient limiter or to disconnect the receiving device when the LISN is switched on or off. The used LISN, spectrum analyser and/or measurement receiver can be selected under the configuration, tests site pull down menu. |
The measuring device can be configured for the desired test through the Attenuator, RBW, VBW and sweep time settings.
Measurements can be performed in peak, average and quasi peak mode. For Peak mode tests, the number of sweeps to be made, can be selected. For Quasi Peak and Average measurements, the number of points can be entered on which the QP and average measurements are made. The QP and average measurements are made on the highest emission points as measured during the peak sweeps. RadiMation® automatically selects the highest peaks from the peak measurement file and performs the QP measurements on these peaks.
When the measurements must be repeated on more than one phase, simply select all phases to measure. The configured test can be saved as a TSF file for use at a later time. When conducted emission tests must be performed in different frequency bands, several TSF files can be placed in a sequence file. The next chapters explain in depth how a test should be configured.
LISN measurements[edit]
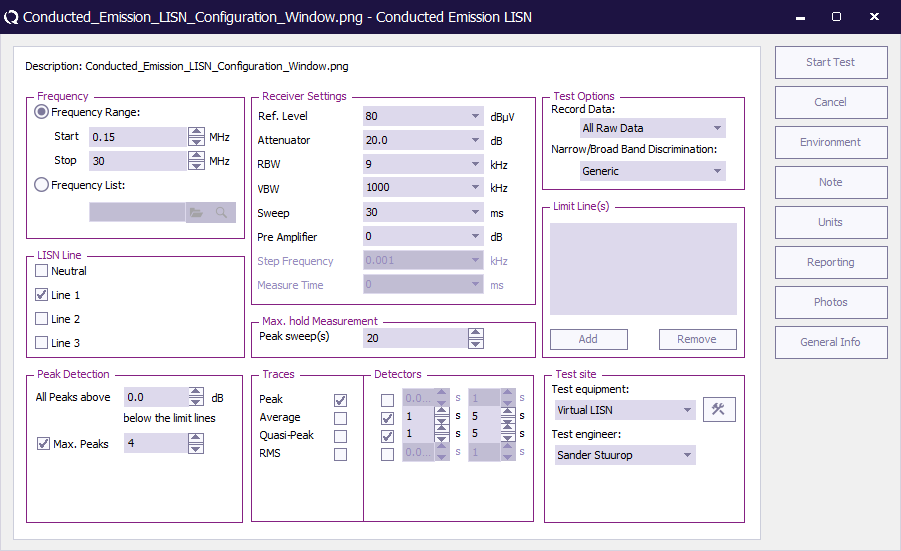
The test engineer can configure a complete conducted emission test in the Conducted Emission configuration menu. To enter this menu, please select Tests > Conducted emission > LISN.
The next paragraphs describe all configuration field of this window.
Frequency window[edit]
In the frequency window, the operator can enter a frequency range to be measured or select a frequency list.
When the Frequency range is selected, the following items can be entered:
| Sets start frequency |
| Sets stop frequency |
When the frequency list is selected the operator can select a frequency list file by browsing to the file location. With the start-stop frequency the software searches for the peaks, while with a frequency list the frequencies on the list are measured.
LISN line window[edit]
In this window the operator can select which lines have to be measured. The operator can either select to measure just one LINE at a time (and have the possiblity to put them in a sequence) or select two or more lines in the same test.
When two or more LINES are selected in the same test, all data will be displayed in one graph thus losing information. However the peak list table will show on which LINE a peak was measured.
If the emission graphs of all separate LINES are required, separate tests must be configured for each LINE. These tests can be put in a sequence, eliminating the need for a user intervention.
Receiver settings[edit]
| Sets the reference level of the receiver. |
| Sets the receiver attenuator level. |
| Sets the Resolution BandWidth filter. |
| Sets the Video BandWidth filter. |
| Sets the sweep time of the receiver. |
| Sets the pre-amp gain. |
| Sets the frequency step size of the receiver. |
| Sets the measure time of the receiver. |
When a parameter is set to auto, RadiMation® will determine the most optimal settings for this parameter. If the parameter is set to coupled, the parameter will be set to automatic internally in the receiver.
Max. hold measurements[edit]
In this window the number of peak hold sweeps for each measurement can be selected. If this value is set to, for example 10, the software will measure the frequency band 10 times for each turntable and antenna tower position. This value will normally be set to 1 for measurement receivers while a higher value is used for spectrum analysers. The amount of required peak sweeps is depending on the type of signal and the setting of the sweepspeed. For spectrum analysers and CW signals you can use a relatively low amount of peaksweeps, for example 10. But when you have discontinuous signals like a spark bridge, you may need 100 peaksweeps or more. A good indication if you are using enough peak sweeps is to look at the envelope of the frequency spectrum. When it has gaps or jumps then you are not using enough sweeps to determine a correct signal envelope.
Traces window[edit]
In the traces window, the test engineer can select a maximum of four traces which can be measured and displayed at the same time.
Detectors window[edit]
In the detectors window the test engineer can configure the detectors used during the final emission measurements of the detected peaks. The first value is the time constant of the detector while the second value is used for the measure time at each frequency point for this detector. The time constant is send to the receiver, to set the sample time of the detector. To select a detector, check the desired box.
Peak detection window[edit]
| In the peak detection window, the test engineer can configure which signal peaks must be detected. If the operator selects a value of 6 dB, the software will detect all peaks, which are higher than 6 dB below the limit line. |
| Under max. peaks, the user can limit the number of peak signals the software will detect and re-measure. |
Test site window[edit]
| In the test site window the test engineer can select which equipment list will be used during this test. |
| In the test engineer window, the test engineer can select their own name. The test engineer name will be stored by the test results. |
| By clicking on the equipment icon, the equipment list can be viewed and edited. |
Limit lines window[edit]
In the limit line window the operator select one or more limit lines to be used during the test.
Test options window[edit]
In the test options window the operator can select whether all RAW data must be stored or only the measurement results are stored. It should be noted that for full traceability, all test data should be stored.
Test site information[edit]
| # | Device name | Tab in RadiMation® configuration window |
|---|---|---|
| Spectrum analyser | devices 2 | |
| Pre amplifier | devices 2 | |
| LISN | devices 2 | |
| Cables | ||
| 1 | cable Preamp -> analyser | Cables |
| 2 | cable antenna -> Preamp | Cables |
| Note: | Usage of cable correction factors is not mandatory. However, using correction factors will increase measurement accuracy during emission measurements. When in doubt contact your reseller. |
Absorbing clamp measurements[edit]
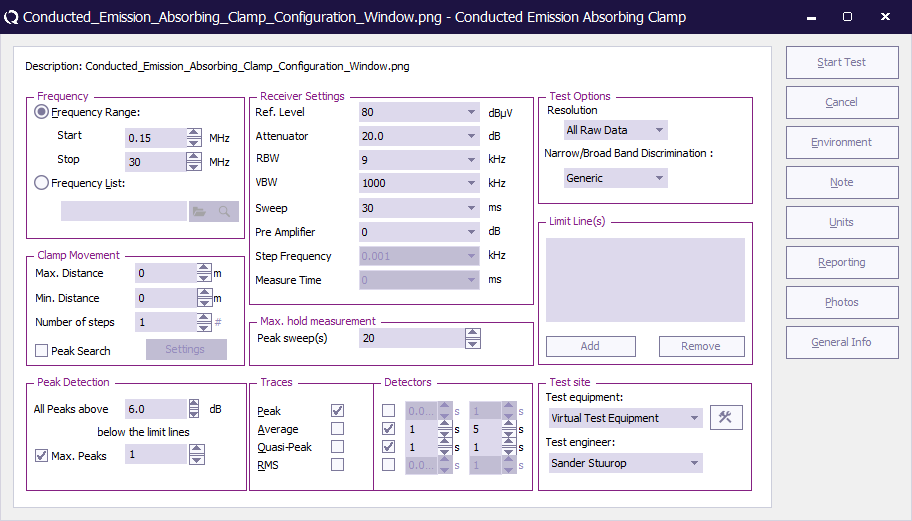
Absorbing clamp measurements can be performed fully automatically when a clamp positioner is used. The test engineer can configure a complete absorbing clamp test in the Conducted Emission-Absorbing clamp configuration menu. To enter this menu, please select
-
 Tests
Tests
-
 Conducted emission
-
 Absorbing clamp
-
-
-
Frequency window[edit]
In the frequency window, the operator can enter a frequency range to be measured or select a frequency list.
When the Frequency range is selected, the following items can be entered:
| Sets start frequency. |
| Sets stop frequency. |
When the frequency list is selected the operator can select a frequency list file by browsing to the file location.
Clamp movement window[edit]
In this window the operator can select the start and stop position of the clamp and the number of steps for the clamp.
| Sets the maximum clamp position. |
| Sets the minimum clamp position. |
| Number of locations from Max. distance to Min. distance that should be measured. |
| The software will automatically detect on which clamp distance the maximum measurement value of each peak is present. |
When Peak search is selected, the user can configure the method that is used during the peak search. In the peak search configuration window, the following configurations can be made:
| Range over which the peak search will be performed. The initially detected clamp distance of the peak will be the middle of this Area, and the total search area for this peak will be half of this area up and half of this area down. |
| The step size for each clamp movement. |
| This value is only used during the Intelligent mode. It influences how long the movement is continued. The movement will stop when the measurement value is lower than the specified Threshold below the highest known measurement value of the searched peak. |
The mode setting determines the way a peak is detected. The following modes are available:
The Intelligent mode has the advantage that it stops with the scan as soon as a maximum measurement value has been determined. This could improve overall testtime as less movement of the clamp is possible. The Complete area mode has the advantage that the complete specified Area is measured. |
Intelligent[edit]
In this mode the software increases the distance of the clamp from the initial point with a step equal to Step size as long as the measurement value is not more than Threshold below the already known maximum measurement value. As soon as a measurement value is detected that is Threshold below the already known maximum value, the clamp movement is reversed until the initial point and from this initial point the distance of the clamp is decreased with a step equal to Step size until a measurement value is measured that is Threshold below the already known maximum measurement value. The step on which the highest measurement value is measured, will be the optimum peak search location that is found for that peak.
| Warning: | This might cause a measurement error if the initial number of steps (#) is set to a low value. |
Complete area[edit]
In this mode the complete area around the initial point and defined by Area is scanned for a peak. The clamp is moved to one end of the to be measured area, and is then moved with the specified Step size to the other end of the to be measured area. On each step the measurement value is determined, and the step on which the highest measurement value is measured, will be the optimum peak search location that is found for that peak.
| Warning: | This might cause a measurement error if the Area is set to a smaller value than the original stepsize (given by the stop position minus start position divided by the number of steps). |
Receiver settings[edit]
| Sets the reference level of the receiver. |
| Sets the receiver attenuator level. |
| Sets the Resolution BandWidth filter. |
| Sets the Video BandWidth filter. |
| Sets the sweep time of the receiver. |
| Sets the pre-amp gain. |
| Sets the frequency step size of the receiver. |
| Sets the measure time of the receiver. |
When a parameter is set to auto, RadiMation® will determine the most optimal settings for this parameter. If the parameter is set to coupled, the parameter will be set to automatic internally in the receiver.
Max. hold measurements[edit]
In this window the number of peak hold sweeps for each measurement can be selected. If this value is set to, for example 10, the software will measure the frequency band 10 times for each turntable and antenna tower position. This value will normally be set to 1 for measurement receivers while a higher value is used for spectrum analysers. The amount of required peak sweeps is depending on the type of signal and the setting of the sweepspeed. For spectrum analysers and CW signals you can use a relatively low amount of peaksweeps, for example 10. But when you have discontinuous signals like a spark bridge, you may need 100 peaksweeps or more. A good indication if you are using enough peak sweeps is to look at the envelope of the frequency spectrum. When it has gaps or jumps then you are not using enough sweeps to determine a correct signal envelope.
Traces window[edit]
In the traces window, the test engineer can select a maximum of four traces which can be measured and displayed at the same time.
Detectors window[edit]
In the detectors window the test engineer can configure the detectors used during the final emission measurements of the detected peaks. The first value is the time constant of the detector while the second value is used for the measure time at each frequency point for this detector. The time constant is send to the receiver, to set the sample time of the detector. To select a detector, check the desired box.
Peak detection window[edit]
| In the peak detection window, the test engineer can configure which signal peaks must be detected. If the operator selects a value of 6 dB, the software will detect all peaks, which are higher than 6 dB below the limit line. |
| Under max. peaks, the user can limit the number of peak signals the software will detect and re-measure. |
Test site window[edit]
| In the test site window the test engineer can select which equipment list will be used during this test. |
| In the test engineer window, the test engineer can select their own name. The test engineer name will be stored by the test results. |
| By clicking on the equipment icon, the equipment list can be viewed and edited. |
Limit lines window[edit]
In the limit line window the operator select one or more limit lines to be used during the test.
Test options window[edit]
In the test options window the operator can select whether all RAW data must be stored or only the measurement results are stored. It should be noted that for full traceability, all test data should be stored.
Test site information[edit]
| # | Device name | Tab in RadiMation® configuration window |
|---|---|---|
| Spectrum analyser | devices 2 | |
| Pre amplifier | devices 2 | |
| Current sensor | devices 2 | |
| Cables | ||
| 1 | cable preamp -> analyser | Cables |
| 2 | cable antenna -> Preamp | Cables |
| Note: | Usage of cable correction factors is not mandatory. However, using correction factors will increase measurement accuracy during emission measurements. When in doubt contact your reseller. |
Current Probe Measurement[edit]
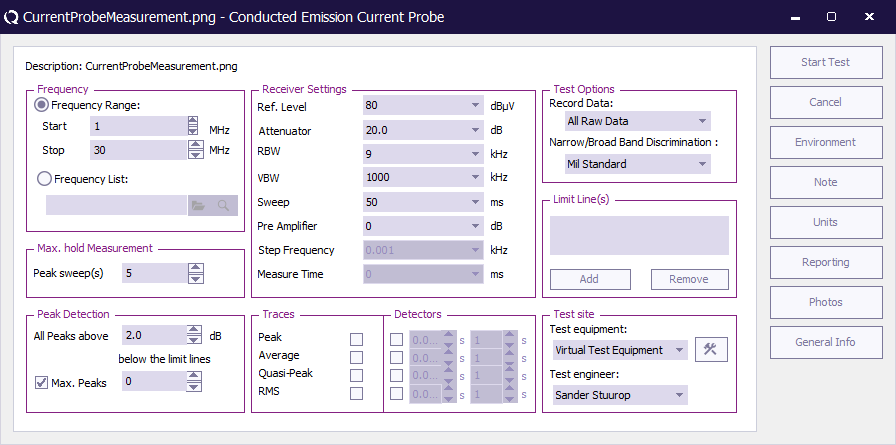
The test engineer can perform a conducted emission test in the conducted emission configuration Menu. To enter this menu, please select Tests > Conducted Emission -> Current probe
Frequency Window[edit]
In the frequency window, the operator can enter a frequency range to be measured or select a frequency list.
When the Frequency range is selected, the following items can be entered:
| Sets start frequency |
| Sets stop frequency |
When the frequency list is selected the operator can select a frequency list file by browsing to the file location. With the start-stop frequency the software searches for the peaks, while with a frequency list the frequencies on the list are measured.
Max. Hold Measurement/Peak Sweeps[edit]
The number of peak hold sweeps for each measurement can be selected. If this value is set to, for example 10, the software will measure the frequency band 10 times. This value will normally be set to 1 for measurement receivers while a higher value is used for spectrum analysers. The amount of required peak sweeps is depending on the type of signal and the setting of the sweep speed. For spectrum analysers and CW signals you can use a relatively low amount of peak sweeps, for example 10. But when you have discontinuous signals like a spark bridge, you may need 100 peak sweeps or more. A good indication if you are using enough peak sweeps is to look at the envelope of the frequency spectrum. When it has gaps or jumps then you are not using enough sweeps to determine a correct signal envelope.
Peak detection window[edit]
| In the peak detection window, the test engineer can configure which signal peaks must be detected. If the operator selects a value of 6 dB, the software will detect all peaks, which are higher than 6 dB below the limit line. |
| With the max. peaks option, the user can limit the number of peak signals the software will detect and re-measure. |
Receiver Settings[edit]
| Sets the reference level of the receiver |
| Sets the receiver attenuator level |
| Sets the Resolution BandWidth filter |
| Sets the Video BandWidth filter |
| Sets the sweep time of the receiver |
| Sets the pre-amp gain |
| Sets the frequency step size of the receiver |
| Sets the measure time of the receiver |
When a parameter is set to auto, RadiMation® will determine the most optimal settings for this parameter. If the parameter is set to coupled, the parameter will be set to automatic internally in the receiver. However, using the 'Auto' setting for the attenuator can let the analyser decides to use a different attenuator setting during (re-)measuring of a peak, which as a result can lead to measuring a higher Quasi-Peak value than the Peak value. This is related to the used analyser when auto attenuator is used. If it is not desired that the analyser can decide to switch to a different attenuator setting, then this should be disabled by the test engineer in RadiMation® by using a fixed attenuator value.
| Warning: | All these settings are generic. Therefore, always verify that the configured settings are also supported by the used hardware to ensure it is correctly used and no measurement faults are introduced. Use a fixed value to disabled interference of equipment intelligence. |
Traces[edit]
In the traces window, the test engineer can select a maximum of four traces, which can be measured and displayed at the same time
Test Options[edit]
| Select to record all raw data or only the results. When choosing only the results you will only have the data from the found peaks and the data of the final measurement when this is performed |
| Selects the method used to determine if a signal is broad band or narrow band. There are three options: Generic (The standard of your analyser)/CISPR 25 (Broad/Narrow band discrimination according to the CISPR 25 standard)/MilStandard(Broad/Narrow band discrimination according to the MilStandard |
Limit lines window[edit]
In the limit line window the operator can select one or more limit lines to be used during the test.
Test site window[edit]
| In the test site window the test engineer can select which equipment list will be used during this test. |
| In the test engineer window, the test engineer can select their own name. The test engineer name will be stored by the test results. |
Starting a test[edit]
Loading a TSF file[edit]
To start a conducted emission test, an EUT file must be defined first. From the menu, select:
-
 Tests
Tests
-
 Conducted emission
-
 CISPR LISN
-
-
-
After a TSF file has been selected, the emission configuration window will appear.
When a TSF file is loaded, all test parameters will be already configured and pressing the start button on the right side of the screen can start the test.
When no TSF file is loaded (by pressing Cancel in the TSF selection window) all parameters will be at zero and can be configured by the operator.
Test initialisation and self test[edit]
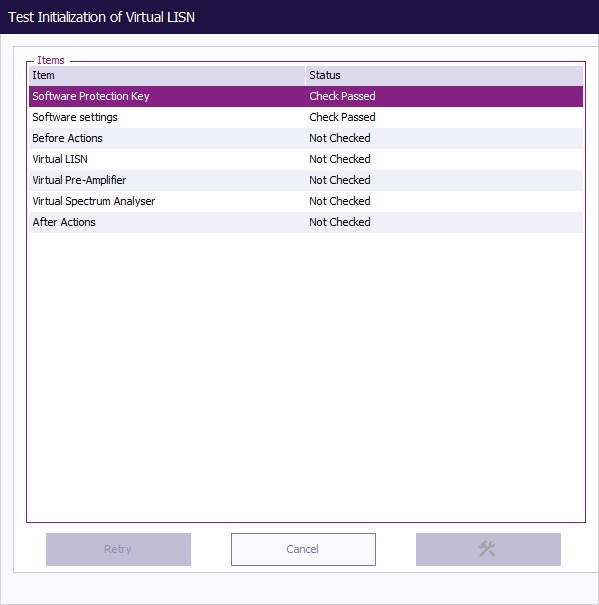
When the start button is pressed, the software first runs a number of checks.
- The presence of a valid software key is checked.
- The software settings are checked (i.e. is all test equipment used within its parameters?)
- The presence of all test equipment is checked.
- All relevant equipment will be initialized.
When one or more of the above tests fail, an error message is displayed.
Manual mode[edit]
For product improvements, it quite often is required to operate the test setup in manual mode. This can be done either by operating the measurement receiver (or spectrum analyser) manually or by the RadiMation® software. In our opinion it is no use to take over the buttons of the receiver without adding any extra functionality. For this reason a number of handy features are included in manual mode.
Receiver settings[edit]
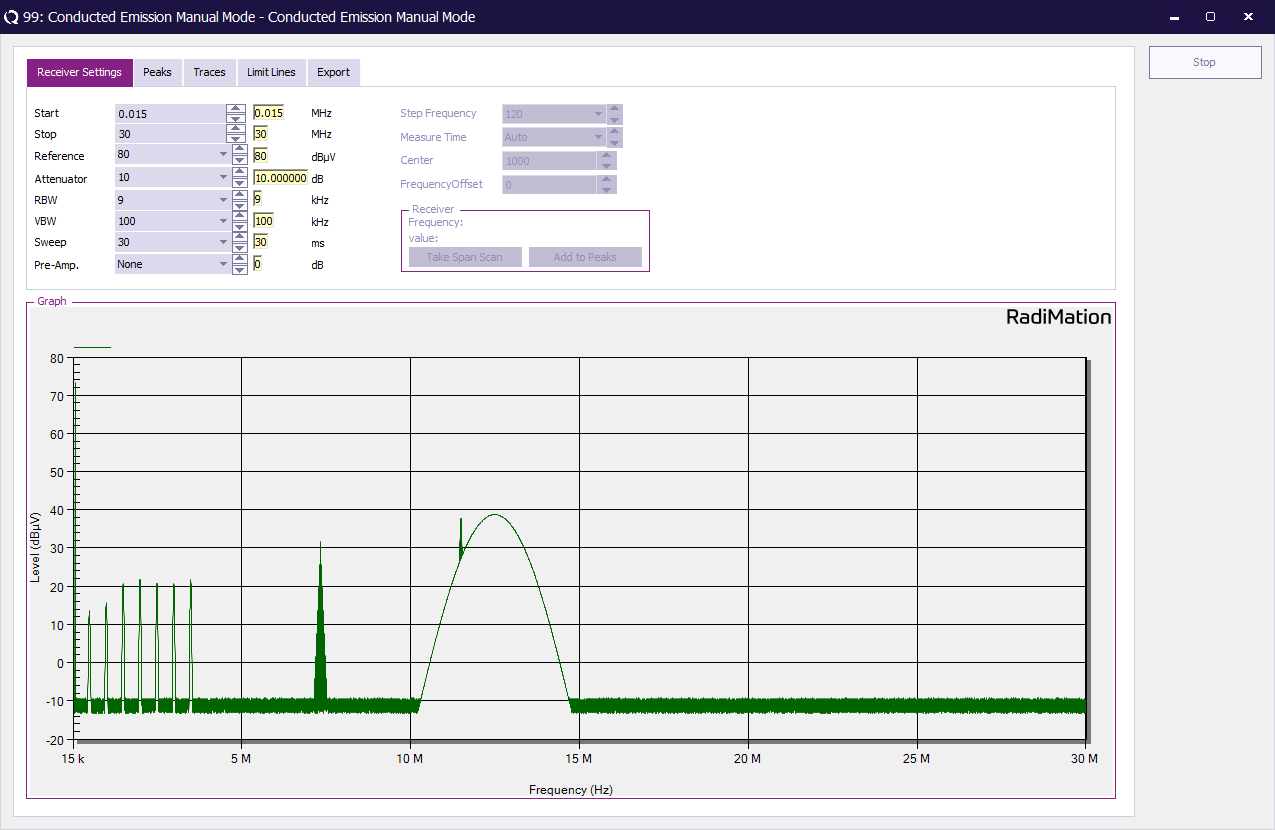
The receiver settings menu allows the operator to configure the measurement receiver. The following parameters can be configured:
| Sets start frequency. |
| Sets stop frequency. |
| Sets the reference level of the receiver. |
| Sets the receiver attenuator level. |
| Sets the Resolution Band Width filter. |
| Sets the Video Band Width filter. |
| Sets the sweep time of the receiver. |
| Sets the pre-amp gain. |
When a parameter is set to auto, RadiMation® will determine the most optimal settings for this parameter. If the parameter is set to coupled, the parameter will be set to automatic internally in the receiver.
The left column in the receiver settings menu shows the parameters as configured by the test engineer while the right column shows the actual receiver configuration.
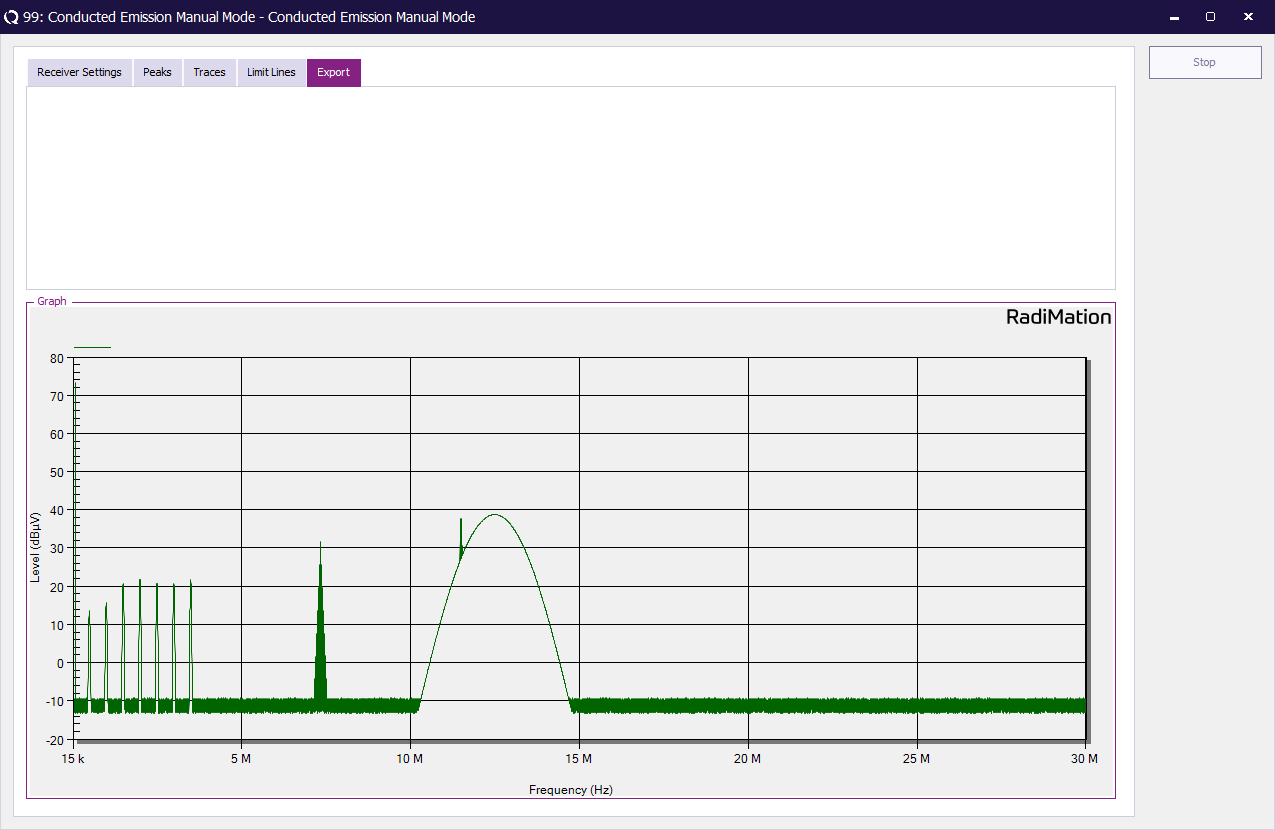
The figure below shows the receiver settings menu.
Data correction[edit]
The manual mode of RadiMation® uses the PC screen to display the emission data real time on the computer screen. However the measured data is corrected for antenna factors and cable losses.
[edit]
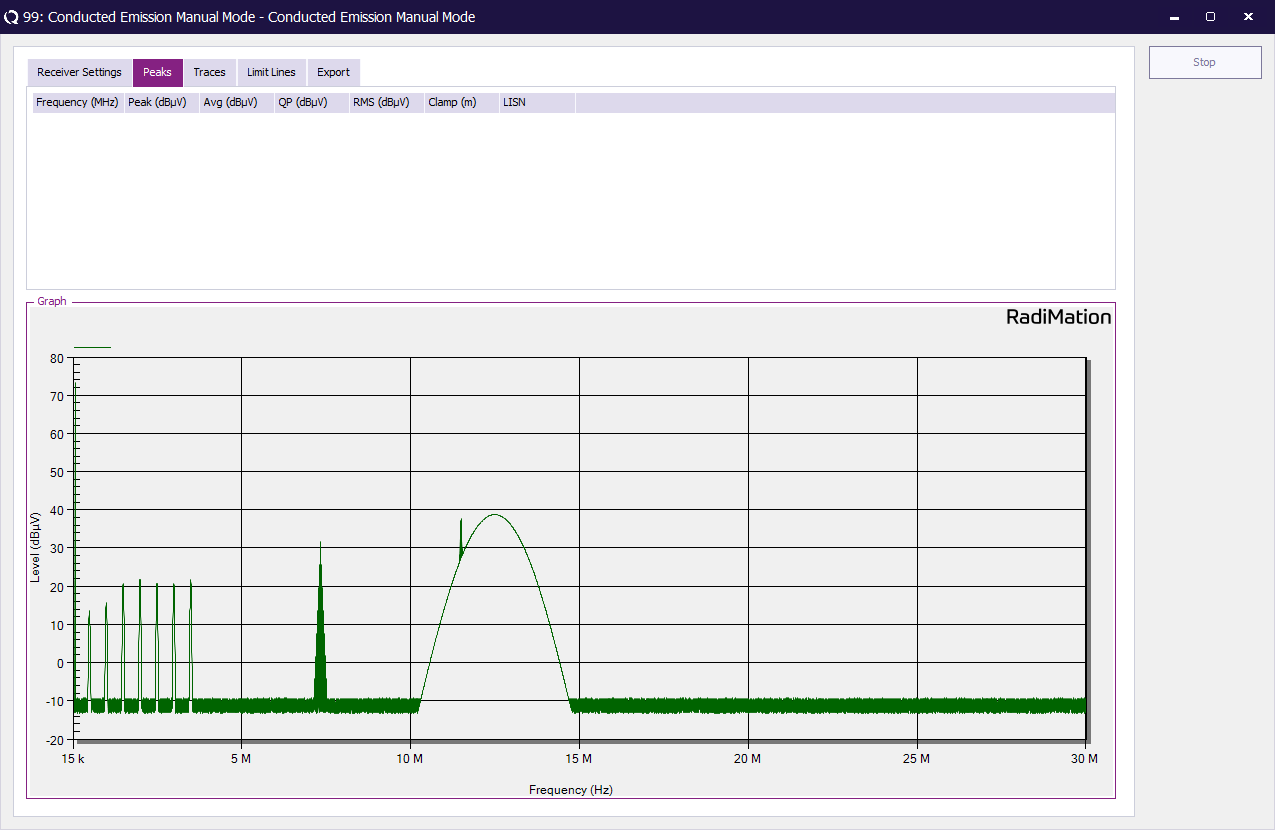
| RadiMation® can detect peaks automatically. From the “peaks” TAB, choose “Search peak” to detect the maximum signal. The software will measure the detected peak. |
| The measured values can be added to the peak list by pressing the “Add Peak” button. |
| By pressing the “Search Angle” button, the software starts a turntable scan to determine at which turn table angle maximum emission takes place. |
| By pressing the “Search Height” button, the software starts an antenna height scan to determine at which antenna height maximum emission takes place. |
The picture below shows the “manual mode” peak list option.
[edit]
Traces[edit]
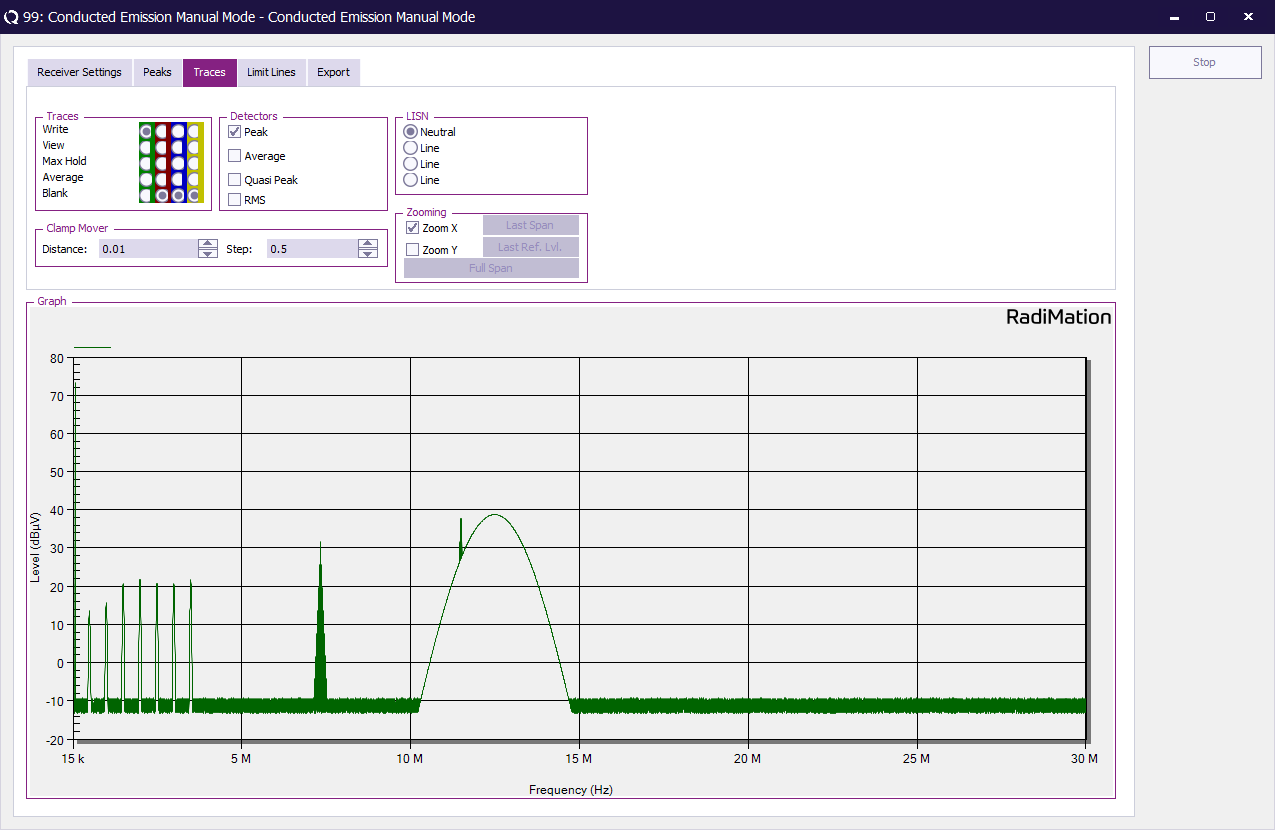
In the “traces” menu, a maximum of four traces can be switched on. Each trace can be appointed to be a Max hold trace, Average trace, Write trace or be switched either to View mode or just left Blank.
The figure below shows the traces menu:
Detectors[edit]
In the traces menu, The following detectors can be switched on and off:
- Peak detector
- Average detector
- Quasi peak detector
- RMS detector
LISN line selection[edit]
In this window the operator can select which line will be monitored. In manual mode only one line at a time can be selected.
Zoom function[edit]
When the operator wants to “zoom in” on a certain signal just use the mouse to drag a box around the signal of interest. The RadiMation® software will fully automatically zoom in to this signal. The screen, as well as the measurement receiver will be zoomed. This reduces the number of actions for the operator significantly.
The figure below shows how to drag a box to zoom into a graph, while the second graph shows the zoomed graph.
The following options are possible for the automatic zooming function:
X-axis, When this option is switched on, the frequency settings of the receiver and the graph will be automatically adjusted when the user zooms in to the graph.
Y-axis, When this option is switched on, the amplitude settings of the receiver and the graph will be automatically adjusted when the user zooms in to the graph.
Under the “traces” TAB, the user can select two different ways of zooming:
X-axis, When this option is switched on, the frequency settings of the receiver and the graph will be automatically adjusted when the user zooms in to the graph.
Y-axis, When this option is switched on, the amplitude settings of the receiver and the graph will be automatically adjusted when the user zooms in to the graph.
Limit lines[edit]
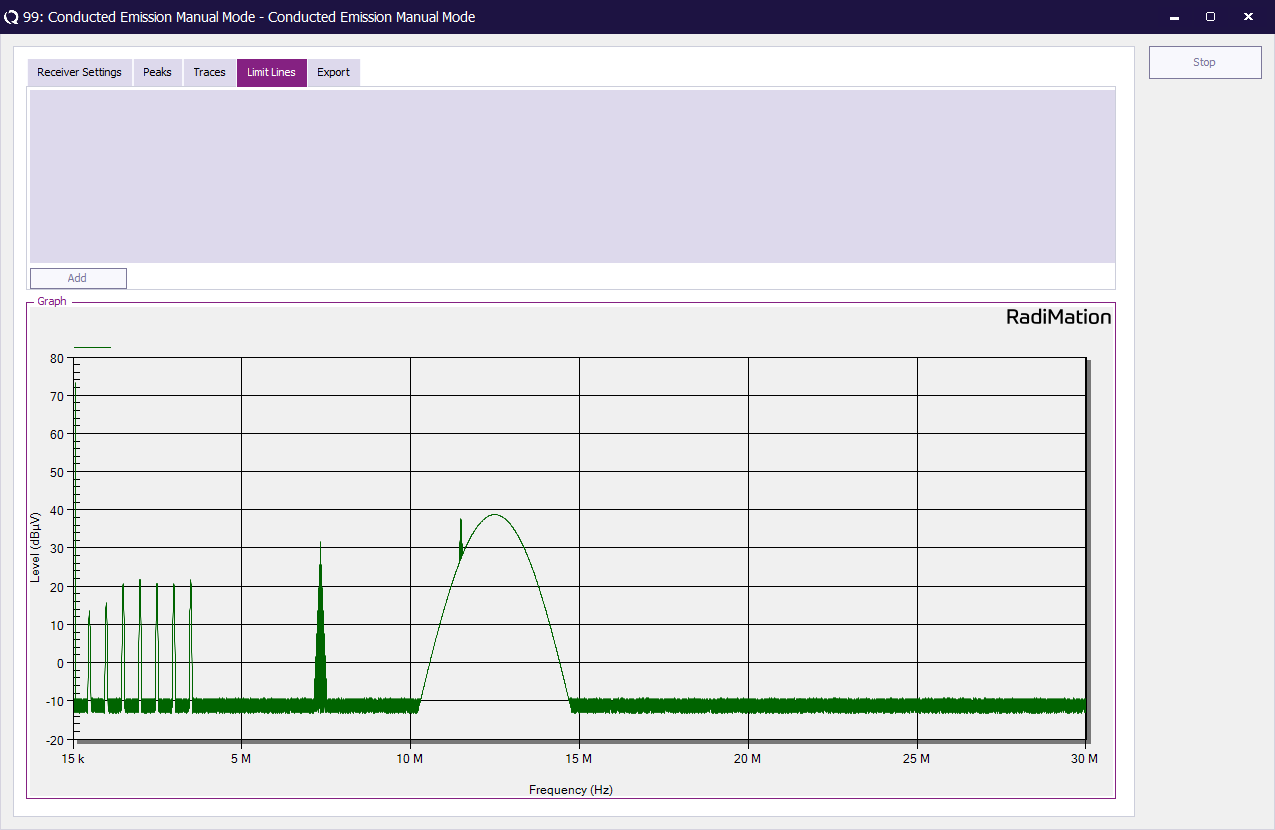
Under the TAB “limit lines”, limit lines can be added to and removed from graphs. The limit lines must be previously defined (See also creating new limit line files).
Short cut keys[edit]
The following short cut keys can be used during manual mode.
| Key | Function |
|---|---|
| F3 | Turn engine of the clampmover left, full speed. |
| F4 | Turn engine of the clampmover left, quarter speed. |
| F5 | Turn engine of the clampmover right, quarter speed. |
| F6 | Turn engine of the clampmover right, full speed. |
| F7 | Frequency offset down. |
| F8 | Frequency offset up. |
| F9 | Center frequency down. |
| F10 | Center frequency up. |
[edit]
Data from the graphs and peak list can be exported to the clip board by pressing the corresponding icons in the export menu. From the clip board, the graph (or table) can be pasted in to any windows application.
Merge function[edit]
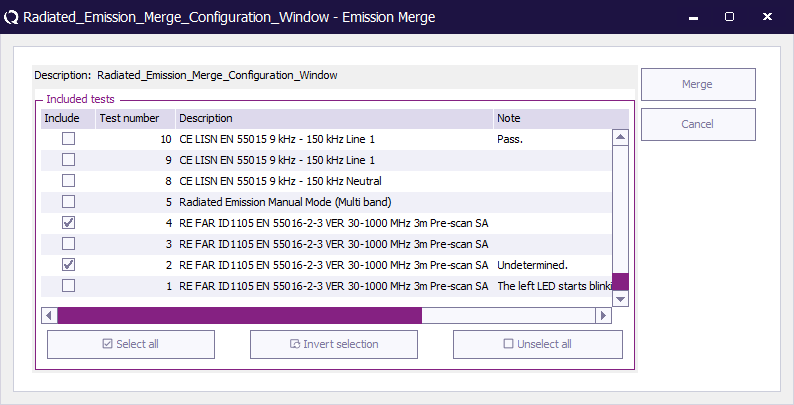
The merge function is used to merge separate emission graphs to one graph.
The figure below shows the merge window. All emission tests, carried out on the Equipment Under Test, will be shown in this menu. The operator can select which emission measurements have to be merged together.
The results of the merge action will be stored in the EUT window, together with all other test results.
X+k*S calculation[edit]
The X+k*S function is a statistic calculation method used when a number of the same measurements are made to the same type of EUT.
The figure below shows the X+k*S function window. All emission tests, carried out on the Equipment Under Test, will be shown in this menu. The operator can select on which emission measurements the calculations have to be performed.
The results of the X+k*S function will be stored in the EUT window, together with all other test results.
Measurement of peak amplitude and peak frequency[edit]
When using a spectrum analyser for emission measurements, RadiMation® first performs a full span max. hold measurement with a peak detector. The number of max. hold peak sweeps can be defined by the user. From the obtained max hold graph, RadiMation® determines a number of peaks, which will be further investigated. The number of peak signals to be measured can be defined by the user. For each peak from the graph, RadiMation® will zoom in, by reducing the span in several steps. This must be done while span inaccuracy of the analyser in large frequency spans will give slightly incorrect frequency information. After the exact peak frequency is determined, RadiMation® will perform Peak,Quasi peak, Average and / or RMS measurements. Due to the above, the finally measured frequency and amplitude of a peak can slightly differ from the max hold graph. This is not an error, but merely an indication that the final measurements are more accurate. The peak table always shows the final measured values (most accurate).
