Chapter 9
Antenna Diagram[edit]
The antenna diagram module of the RadiMation software is developed for special measurements that can be performed to characterise the antenna diagram of a broadcasting antenna by means of a helicopter. This module is only visible to specific customers who are using this module. Because of some slight differences from the general RadiMation concept, it can otherwise be confusing to normal users.
Overview[edit]
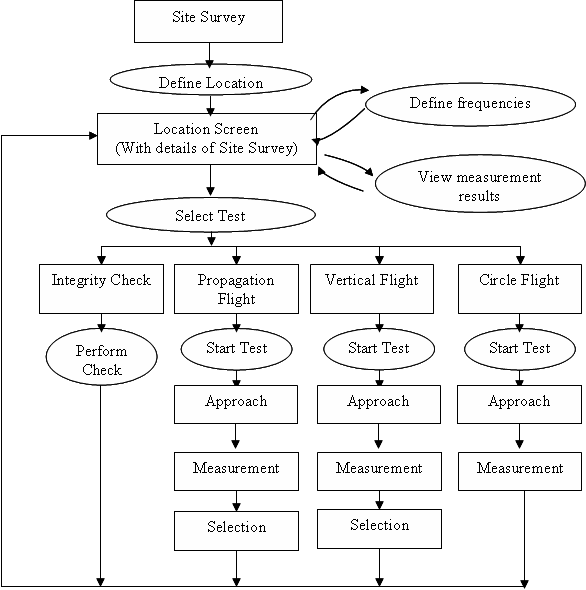
The following steps are normally performed during an antenna diagram measurement:
- Site survey by engineers on the ground
- Preparation of the test on the ground
- Input of information of the antenna tower
- Input of the frequency related information
- Integrity test of all equipment in the helicopter on the ground
- Data collection during flight
- Propagation flight(s)
- Vertical flight(s)
- Circle flight(s)
Before a measurement is started, engineers perform a site survey. The information collected during this survey should be entered in the RadiMation software. The screen where the information should be entered is named the location screen and is described in paragraph 9.2. This screen contains all information relevant and unique for the antenna tower including a section with a maximum of eight different radio stations called frequencies.
These frequencies can be generated from the file pull down menu. On the frequency window all information relevant and unique to the specific frequency and the used antenna can be entered. An unlimited number of frequency files can be generated. These frequency files are all related to the selected tower only. The files will be stored in the directory specific to the current location and the files will be automatically and uniquely named by a combination of the frequency and the program name.
As soon as all required frequency information is entered and saved, the prepared files can be selected with a maximum of eight from the location screen. Only the selected frequencies in the location window will be measured during the measurements
Now all relevant information from the site survey is entered in the RadiMation software and the specific tests can be prepared. This is done by means of so called Test Set-up Files or TSF's. In these files all information on a specific test is entered and stored for future use such that a minimum of effort is needed during the expensive helicopter flight.
Three types of tests are available in the antenna diagram module:
- Propagation flight (see paragraph 0)
- Vertical flight (see paragraph 9.6)
- Circle flight (see paragraph 0)
In the TSF's all information specific to a test can be entered as a preparation of the real test flights.
As soon as all preparations are finished the helicopter can be arranged and prepared with all required equipment properly installed. Before actual takeoff of the helicopter a system integrity check (see paragraph 9.4)can be performed. The presence and working conditions of the necessary hardware (DGPS, receiver and pilot display) is checked in order to ensure that no expensive flight time is lost. As the integrity test is successfully completed the helicopter can takeoff and the actual testing can commence.
The tests will normally be performed in the following order:
- Propagation flight
- Vertical flight
- Circle flight
Although the first two may be omitted. The order is important, as each test will deliver information needed in the subsequent tests. So the propagation flight will deliver information on the exact distance of the vertical flight and will the vertical flight deliver the appropriate information on the height on which the circle flight would optimally be performed. Information of these two measurements will be passed to the circle flight in order to perform a circle flight at the optimum distance and height around the antenna tower.
The circle flight will always be performed in concentric circles around the defined center of the antenna tower. It is known that this center will normally not coincide with the center of the specific antenna. The software will correct the resulting error.
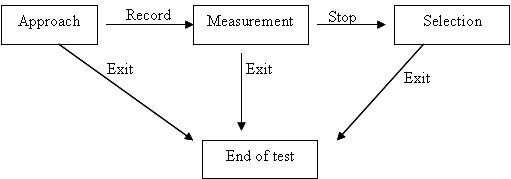
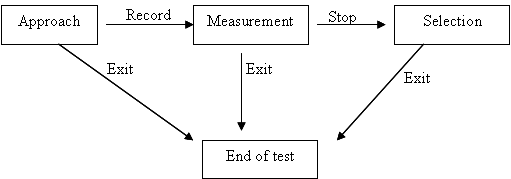
During the helicopter flight a test can be selected from the menu. For example: Tests > Antenna Diagram > Propagation flight will select the Propagation flight test. The user will get an overview of all available configured propagation flight TSF's and he has the possibility to select the appropriate one. If everything is right, pressing the start button will start the actual measurement. First all equipment is checked and intialised. When the initialisation was succesfull a new screen appears that will be available during the measurement. The measurement itself can be split into three phases:
- Approach: The helicopter is directed to the start position of the flight
- Measurement: The actual measurement and recording of the data.
- Selection: Selection of the ideal point in the graph. The selected distance or height will then be used during the other tests.
The circle flight doesn't include the third phase, because it is not necessary to pass an optimal height or distance to one of the other tests. When the measurement is performed and a selection is made, the location window is shown again. Now another test can be started, or the measurement results of an already performed test can be viewed.
Location File[edit]
The Location screen contains all information related to the antenna tower. Most of this information is collected during the site survey or is available from other sources. A new location file can be created by selecting:
-
 File
File
-
 New
New
-
 Location
-
-
-
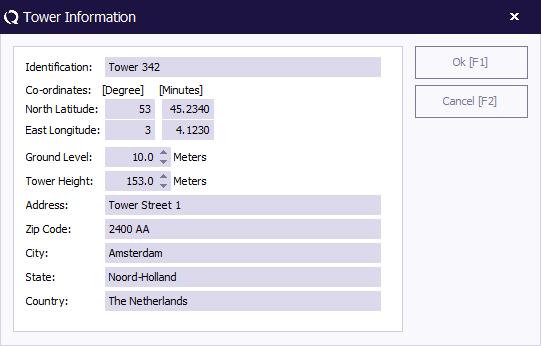
When a new location is made, the user is forced to enter the information of the antenna tower.
The tower information window gives the user the possibility to define:
- Identification: A clear (internal) identification for the antenna tower. This identification will also be used to create an unique filename for the location file
- North Latitude and East Longitude: The exact location of the center of the antenna tower
- Ground level: The ground level at the location of the antenna tower
- Tower Height: The height of the tower
- Adress
- ZIP code
- City
- State
- Country
The items "Identification", "North Latitude", "East Longitude", "Ground level", "Tower height" and "Address" have to be filled in. The items "North Latitude", "East Longitude" and "Ground level" are used during the meaurements to calculate the correct distance between the helicopter and the antenna's in the antenna tower.
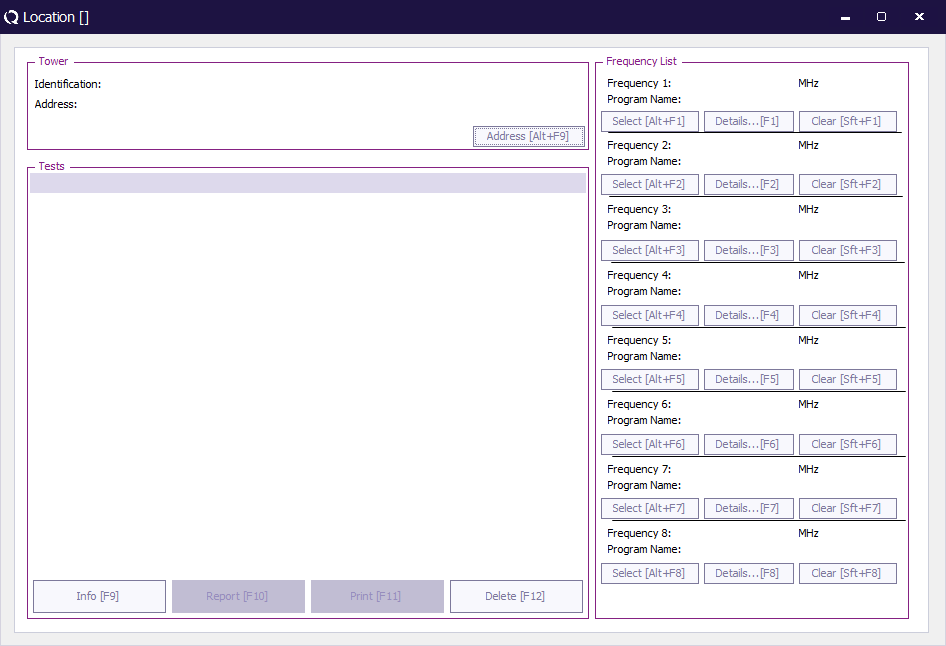
The location window shows the identification and the address of the antenna tower. Pressing the Address button will show additional information of the antenna tower. The white square labeled "Tests" will show all tests performed for this specific tower. The tests are identified by the description of the TSF. So each test generates a single line in the test screen. This line represents the description given to the Test Setup File as described in the three different test. The buttons in the "Tests" area are used to perform operations on the available test-results:
- Info: show the measurements results of the selected test
- Delete: delete the selected test(s). Before the information is actually deleted the user is asked to confirm the delete operation.
On the right side of the screen an overview of a maximum of eight selected frequencies is presented. For each frequency the frequency and the program name are displayed. Buttons below each frequency enable the user to select a frequency file ("Select"), display the details of a selected frequency file ("Details") or clear the frequency from the list ("Clear"). Doing this will unselect the file and clear the related information from the screen. All frequencies below the cleared frequency will shift one position up.
Frequency File[edit]
A frequency file describes the information of a to be measured frequency, and the antenna that is used to transmit the broadcasting signal on that frequency. Most of this information is collected during the site survey or is available from other sources. The information should be entered before the real helicopter measurements are started.
The frequency file will be saved in an unique filename, which is a combination of the frequency and the program name. The frequency file is associated with the location file. This means that a frequency will be stored close to the location file. This results into that a frequency file will not appear in the list of saved frequency files of another location file.
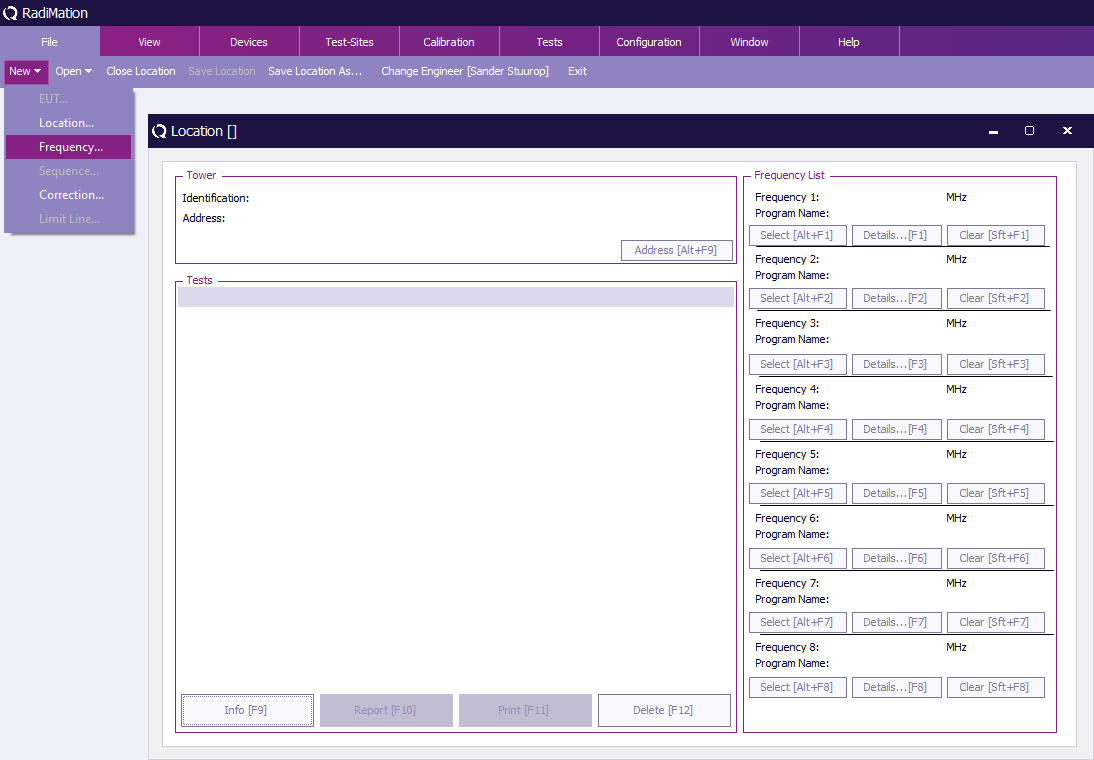
Due to this reason it is necessary that first a new location file is made (see paragraph 9.2). Only when a location file is opened in RadiMation, a new frequency file can be created by selecting:
-
 File
File
-
 New
New
-
 Frequency
-
-
-
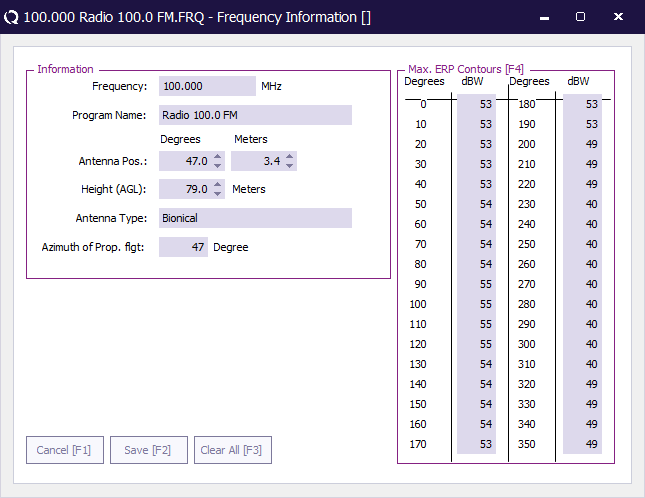
When a new frequency file is made, the frequency information window will appear automatically.
On the frequency information window the following items have to be filled in:
- Frequency: The exact frequency that should be measured during the measurements
- Program Name: A description
- Antenna degree: At which angle the antenna is positioned relative to the center of the antenna tower
- Antenna distance (meters): The distance from the center of the antenna to the center of the antenna tower.
- Height (AGL): The location of the antenna Above the Ground Level (AGL). The ground level at the location of the antenna tower is already specified in the location file.
- Antenna type: A description of the type of the antenna
- Azimuth of Prop. Flgt: The proposed azimuth for the propagation flight.
If the maximum effective radiated power (ERP) of this antenna should be limited to certain values, the user has the possibility to define the maximum ERP values in 10 degree steps. The ERP values have to specified in dBm. The maximum ERP value that can be entered is limited to 70 dBW. The minimum ERP value that can be entered is -40 dBW. It is not necessary to specify an ERP contour for an antenna. But if an ERP value is specified for a specific angle, all the ERP contour values also have to be specified. If an ERP contour is specified the ERP contour will be shown during the circle flight tests. If no contour is specified then no contour for this frequency will be shown during the circle flight test.
The button "Cancel" will close the frequency information window, without saving the changes that were made. The button "Save" will save the entered information into a frequency file. If a frequency file with the correct name does not already exist, the frequency file will be generated. If the frequency or the program name is changed, a new frequency file will be created based on the changed parameters. The button "Clear All" can be used to clear all the ERP values from the ERP contour list.
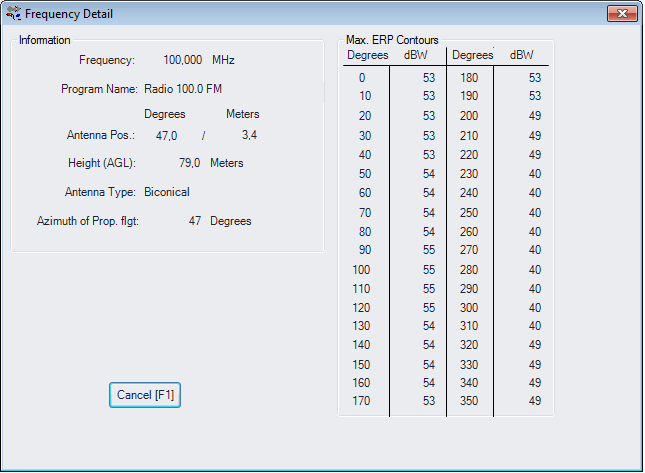
An unlimited number of different frequency files can be created. However only a maximum of 8 different frequencies can be selected at one time in a location file. On the location window eight frequency boxes are present. After a frequency file has been created, a frequency can be selected in one of these boxes by pushing the "Select" button. Only the frequency and the program name will be displayed on the location screen. As soon as a file is selected all parameters are defined. The "Details" button can be used to show the information inside the selected frequency file.
The button "Clear" will unselect a frequency file from the location window. The related information of the frequency will also be removed from the window. All frequencies below the cleared frequency will shift one position up.
Integrity Test[edit]
The integrity Test is not a real test in the sense that it is used to collect or measure real data. The integrity Test is meant to check the if complete system is correctly setup in the helicopter before takeoff. With the help of the integrity test is it possible to decrease the helicopter flying time (which is extremely expensive) to a minimum by ensuring that all the equipment is correctly setup.
The integrity test can be started by selecting from the pull down menu:
-
 Tests
Tests
-
 Antenna Diagram
-
 Integrity Test
-
-
-
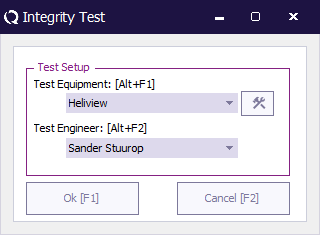
It is possible to start the integrity test with and without an open location file. The only parameters that have to be specified is, which test-site has to be used to check all the equipment.
When the "Ok" button is pressed, the integrity test will be started.
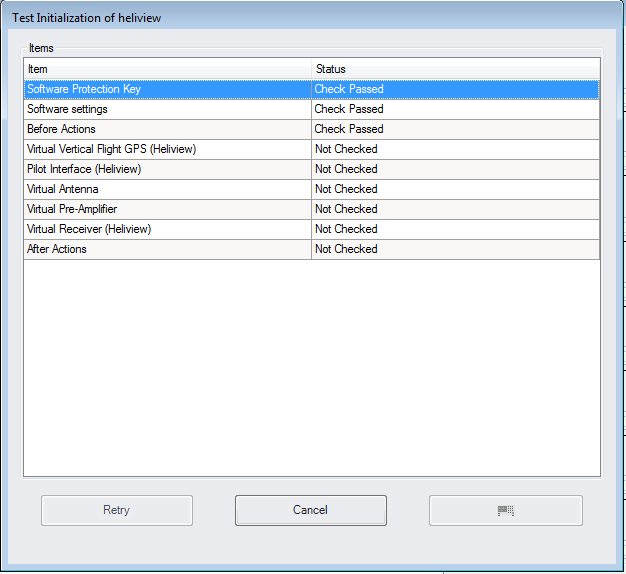
The following items are checked and initialized:
- Software protection key
- Software settings
- GPS receiver
- Antenna
- Pre-Amplifier
- Receiver
- Pilot Interface
After the integrity test is performed and all checks and intialisations are passed, the user can be sure that the other tests can be performed. The integrity test will also be automatically be performed before each test is executed as it is always possible some anomalies occur during flying in a helicopter with all sort of vibrations.
Propagation Flight[edit]
After the site survey has been performed and the location and frequency files have been created. the details of propagation flight have to be entered before the actual test is commenced. So from the Test pull down menu the user selects the appropriate test by selecting:
-
 Test
Test
-
 Antenna Diagram
-
 Propagation flight
-
-
-
A window will be shown where the test-engineer has the possibility to select an already configured Test Setup File (TSF) for a propagation flight for this location. When a configured test is selected, the "Ok" button can be pressed, and the test configuration will be opened. If a new configuration has to be made the "New" button can be pressed, which will create a new TSF file for the propagation flight.
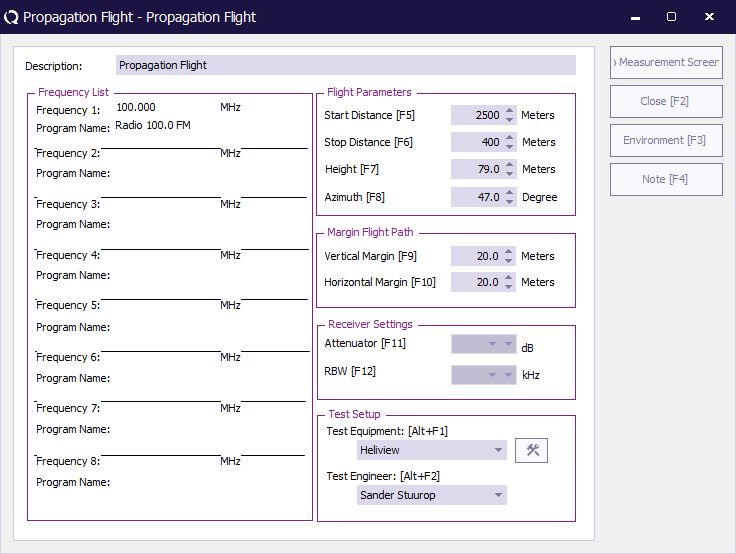
The following screen will appear. This is the input screen for the Test Setup File (TSF) for the Propagation flight.
On the left side of the screen an overview of the selected frequencies is presented. Another four frames respectively represent the information on the flight path (approach) of the test, the margins of the flight path, the receiver settings and the test setup. The following parameters have to be configured:
- Description: A descriptive name for the propagation flight configuration
- Start Distance: the distance from where the helicopter will fly to the antenna tower
- Stop Distance: the distance to the antenna tower, where the measurement has to stop automatically
- Height: the height (above ground level) at which the helicopter should fly
- Azimuth: The direction relative to the antenna tower at which the helicopter should fly
- Horizontal margin: the maximum accepted horizontal deviation of the helicopter opposed to the optimal flight path. This value will be used to show the margins on the pilot interface display to the helicopter pilot. Also when data is measured when the helicopter is outside the valid margins, the data will be plotted in red in the graphs.
- Vertical margin: the maximum accepted vertical deviation of the helicopter opposed to the optimal flight path. This value will be used to show the margins on the pilot interface display to the helicopter pilot. Also when data is measured when the helicopter is outside the valid margins, the data will be plotted in red in the graphs.
- Attenuator: The to be used attenuation setting on the measurement receiver
- RBW: The to be used RBW setting on the measurement receiver
- Test Equipment: The configuration of the test-site which has to be used during the measurements
- Test Engineer: The test-engineer who will perform the measurements
All parameters should be configured, before the measurement can be started.
The following buttons are available:
- Go To Measurement Screen: Start the measurement
- Close: Close this window without starting the measurement
- Environment: Some additional data can be entered like: Temperature, Humidity and Pressure.
- Note: Any kind of information can be entered that could be relevant to this measurement. This note is also available during and after the test.
When all parameters are configured correctly, the configuration of this measurement can be saved as a TSF file. This can be done by selecting from the menu: File > Save TSF. The configuration will be stored in a TSF file with a filename which is the same as the given description. When the configuration is saved to a TSF file, the same configuration can easily be selected the next time a propagation flight should be started.
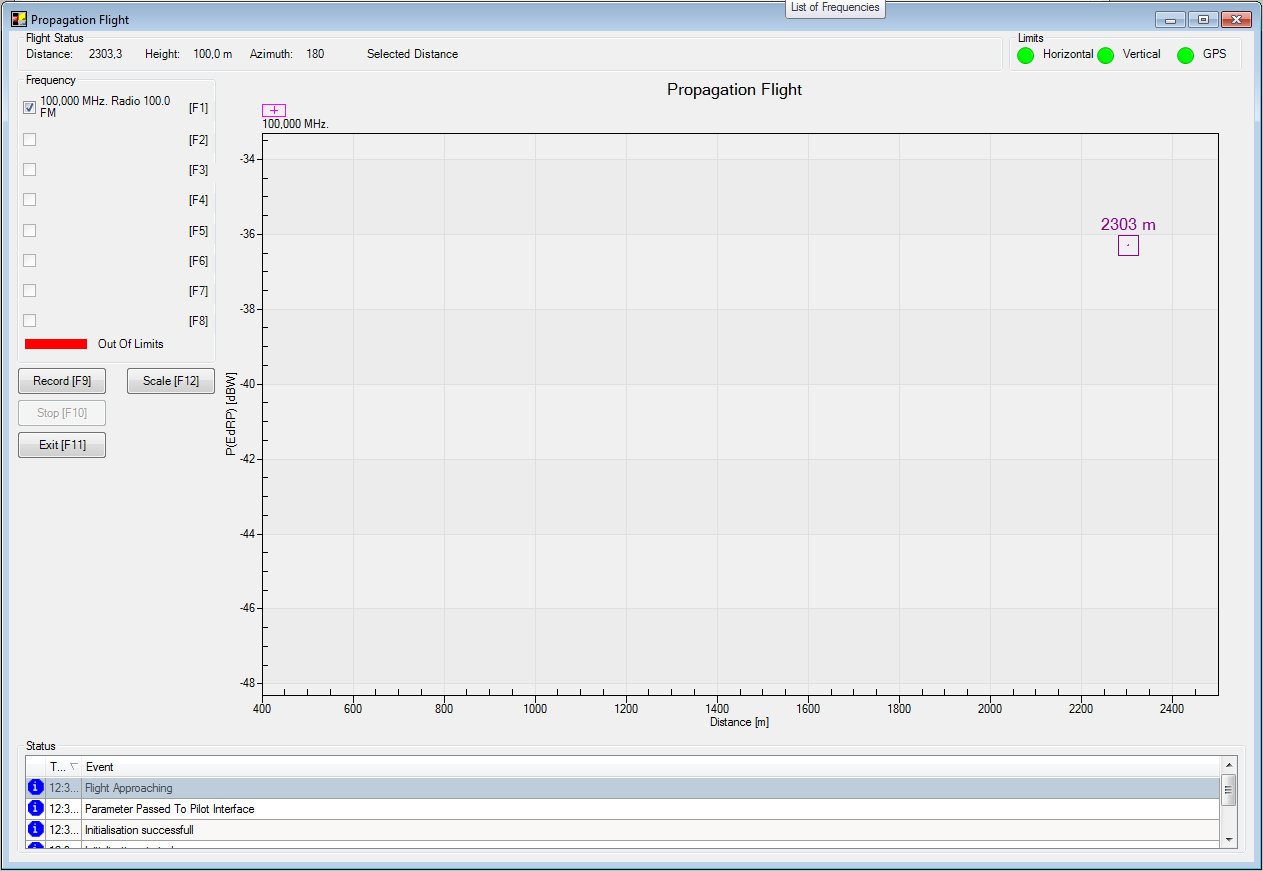
When a propagation flight test is started, first an integrity test is performed. When the integrity test was succesfull the folowing screen will appear:
This window is displaying the current status of the measurement, and all important real-time information is displayed on this window during the measurement:
- Distance: The current distance of the helicopter to the antenna tower
- Height: The current height of the antenna below the helicopter compared to the ground level
- Azimuth: The current angle between the helicopter and the antenna tower
- Limits: The LEDs are indications of a current error situation:
- Horizontal: the helicopter is within the horizontal margins
- Vertical: the helicopter is within the vertical margins
- GPS: A correct and accurate GPS signal is received
- Status: A list of all informational, warning and error messages during a test. Several warnings and errors can be displayed in this list
The biggest part of the screen is occupied by the graph which contains the measured and calculated ERP power for each measured frequency. Each line in the graph for a frequency is displayed by it's own colour. The legend above the graph is also showing all the currently plotted frequencies. Which frequencies are shown inside the graph is determined by the checkboxes on the left side of the window. By pressing the buttons F1 to F8, frequencies can be turned on or off. All the frequencies are always measured, but only the selected frequencies will be plotted inside the graph. The "Scale" button will calculate a new optimum displaying scale for the graph, and it will redraw the graph with the new scales. The upper Y-value of the graph will be calculated to be 3 dB more than the maximum measured value. The lower Y-value of the graph will be calculated to be 12 dB less than the maximum measured value.
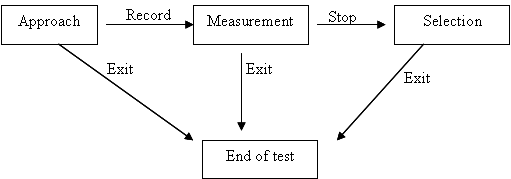
The measurement window also has some buttons that control the measurement phase during the test. The propagation flight has three phases:
- Approach
- Measurement
- Selection
The propagation flight will always start in the Approach phase, this phase should be used to position the helicopter on the correct starting position. Based on the indication of the LEDs, the test-engineer can determine when the correct starting position has been reached. During the Approach phase, the graph will only show the last measured and calculated values for each frequency. When the correct starting position has been reached, the "Record" button should be pushed to enter the measurement phase. In the measurement phase all the measured and calculated ERP values for each frequency will be plotted in the graph. Each the frequency will be plotted in his own colour, except when the helicopter is flying outside the specified margins, if that is the case, the frequencies will be drawn in red. The test-engineer can stop the measurement phase by pressing the "Stop" button. The measurement phase will automatically be ended when the helicopter reaches the specified stop distance.
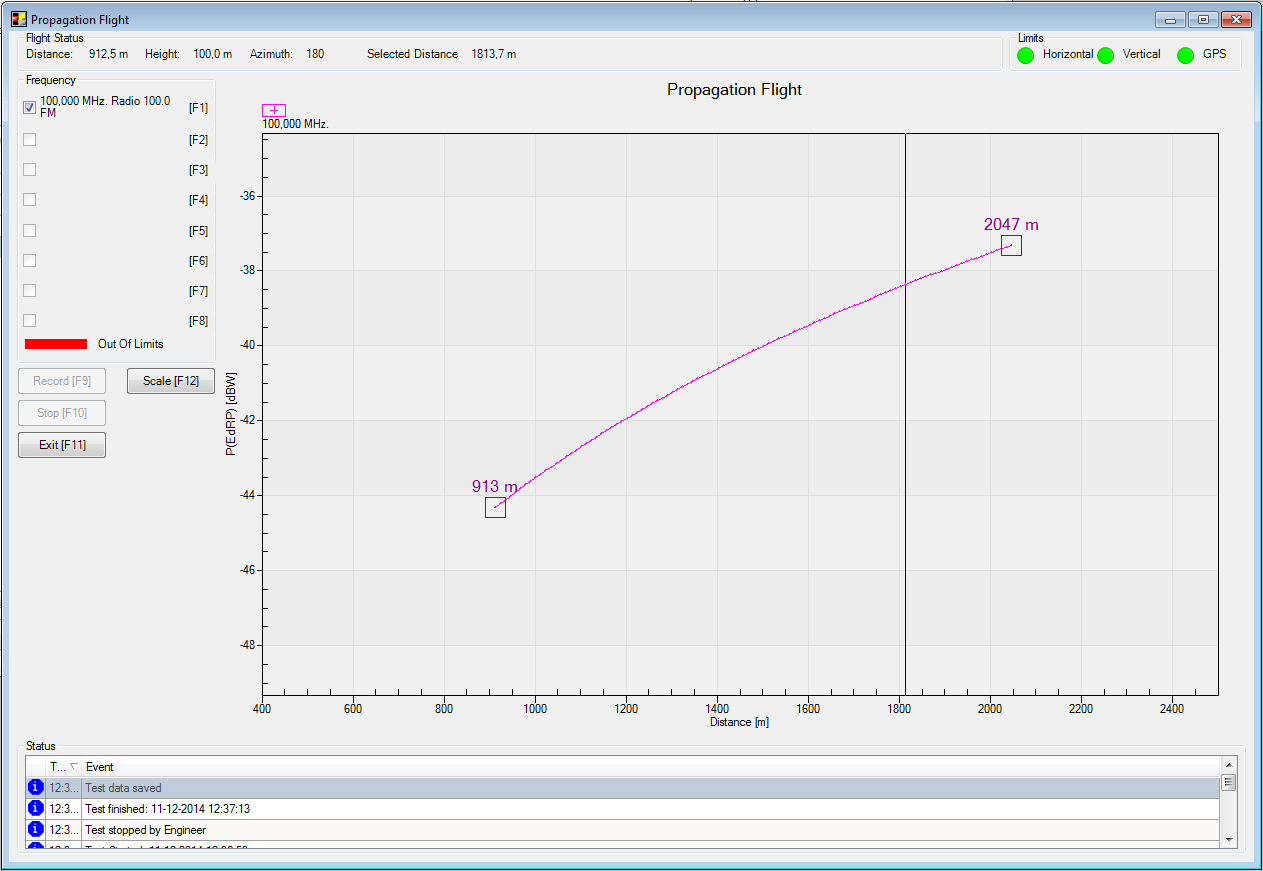
When the propagation flight is in the selection phase, the test-engineer has the possibility to select the best measurement distance for the vertical and circle flight. When the selection phase is entered, the graph will get a selection line. The selection line can be moved with the mouse (by clicking on any frequency in the graph) or with the keyboard. The PageUp key and the Left-Arrow button will move the selection line to the stop distance. The PageDown key and the Right-Arrow button will move the selection line to the start distance. When the selection line is moved, the selected distance in the top of the window will be updated to the selected distance. When the test-engineer has selected the correct distance, the "Exit" button should be pressed. This will end the test, and will deinitialise all the used equipment.
The propagation flight can be stopped from any phase by pressing the "Exit" button.
After completion of the test, the test-engineer can view the data of the measurement in the graph by selecting the test and pressing the "Info" button in the location screen. The same window will appear as during the test, but without the "Record" and "Stop" buttons. Also on this window the available frequencies can also be shown or hidden by selecting the checkboxes on the left part of the window.
Vertical Flight[edit]
After the site survey has been performed and the location and frequency files have been created. the details of vertical flight have to be entered before the actual test is commenced. So from the Test pull down menu the user selects the appropriate test by selecting:
-
 Test
Test
-
 Antenna Diagram
-
 Vertical flight
-
-
-
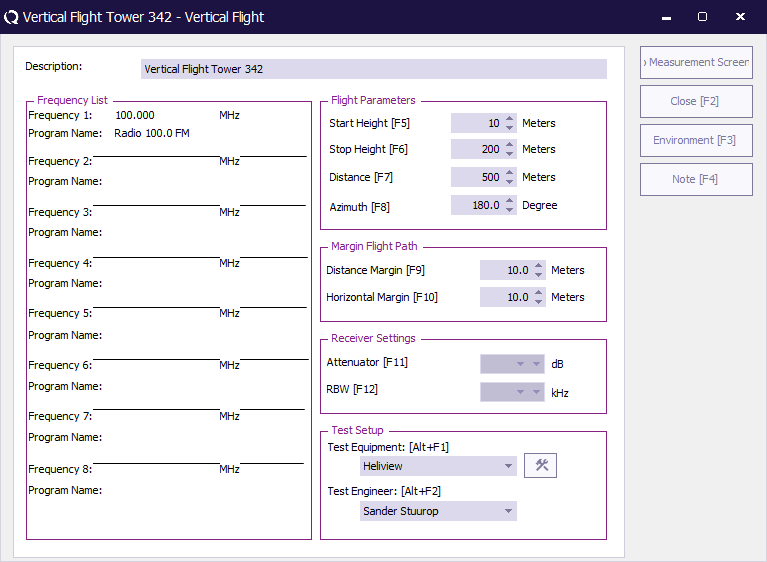
A window will be shown where the test-engineer has the possibility to select an already configured Test Setup File (TSF) for a vertical flight for this location. When a configured test is selected, the "Ok" button can be pressed, and the test configuration will be opened. If a new configuration has to be made the "New" button can be pressed, which will create a new TSF file for the vertical flight. The following screen will appear. This is the input screen for the Test Setup File (TSF) for the Vertical flight.
On the left side of the screen an overview of the selected frequencies is presented. Another four frames respectively represent the information on the flight path (approach) of the test, the margins of the flight path, the receiver settings and the test setup. The following parameters have to be configured:
- Description: A descriptive name for the veritcal flight configuration
- Start Height: the height where the helicopter will start. The helicopter should fly up, so the start height should be lower than the stop height
- Stop Height: the height where the measurement has to stop automatically. The stop height should be higher than the start height.
- Distance: the optimum distance from the antenna tower at which the helicopter should fly. This value will automatically be updated to be the last selected distance from the last propagation flight.
- Azimuth: The direction relative to the antenna tower at which the helicopter should fly
- Distance margin: the maximum accepted distance deviation of the helicopter opposed to the optimal distance. This value will be used to show the margins on the pilot interface display to the helicopter pilot. Also when data is measured when the helicopter is outside the valid margins, the data will be plotted in red in the graphs.
- Vertical margin: the maximum accepted vertical deviation of the helicopter opposed to the optimal flight path. This value will be used to show the margins on the pilot interface display to the helicopter pilot. Also when data is measured when the helicopter is outside the valid margins, the data will be plotted in red in the graphs.
- Attenuator: The to be used attenuation setting on the measurement receiver
- RBW: The to be used RBW setting on the measurement receiver
- Test Equipment: The configuration of the test-site which has to be used during the measurements
- Test Engineer: The test-engineer who will perform the measurements
All parameters should be configured, before the measurement can be started.
The following buttons are available:
- Go To Measurement Screen: Start the measurement
- Close: Close this window without starting the measurement
- Environment: Some additional data can be entered like: Temperature, Humidity and Pressure.
- Note: Any kind of information can be entered that could be relevant to this measurement. This note is also available during and after the test.
When all parameters are configured correctly, the configuration of this measurement can be saved as a TSF file. This can be done by selecting from the menu: File > Save TSF. The configuration will be stored in a TSF file with a filename which is the same as the given description. When the configuration is saved to a TSF file, the same configuration can easily be selected the next time a vertical flight should be started.
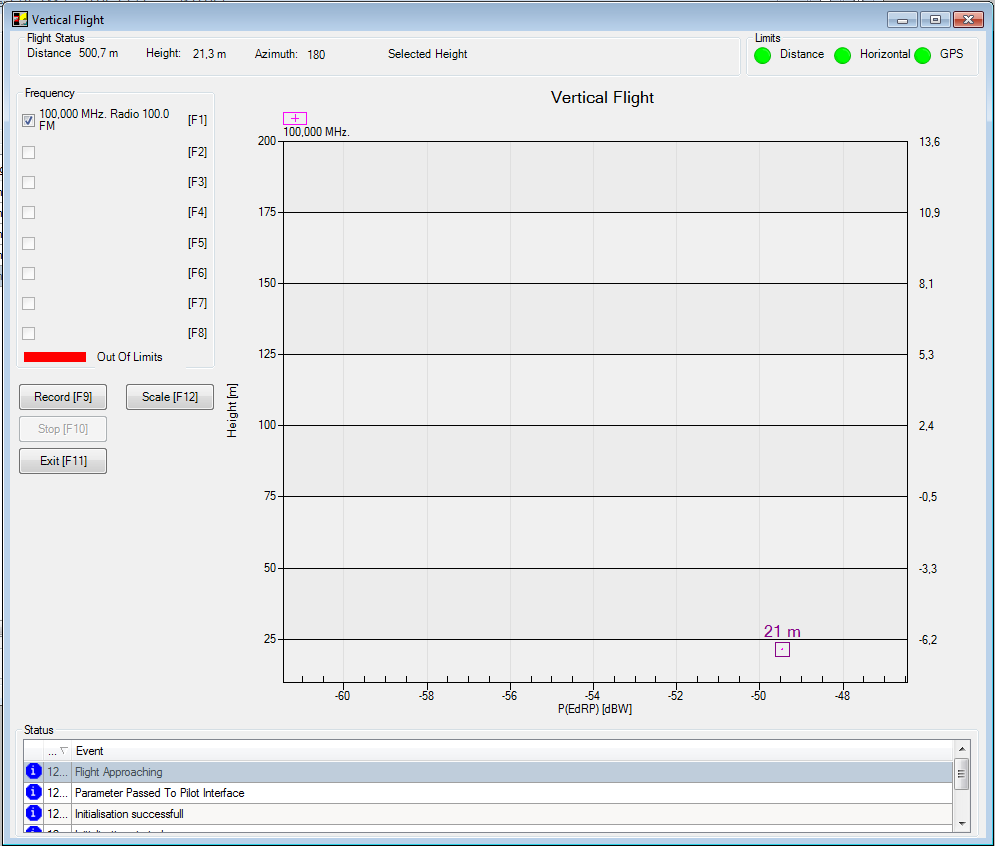
When a vertical flight test is started, first an integrity test is performed. When the integrity test was succesfull the folowing screen will appear:
This window is displaying the current status of the measurement, and all important real-time information is displayed on this window during the measurement:
- Distance: The current distance of the helicopter to the antenna tower
- Height: The current height of the antenna below the helicopter compared to the ground level
- Azimuth: The current angle between the helicopter and the antenna tower
- Limits: The LEDs are indications of a current error situation:
- Distance: the helicopter is within the distance margins
- Horizontal: the helicopter is within the horizontal margins
- GPS: A correct and accurate GPS signal is received
- Status: A list of all informational, warning and error messages during a test. Several warnings and errors can be displayed in this list
The biggest part of the screen is occupied by the graph which contains the measured and calculated ERP power for each measured frequency. Each line in the graph for a frequency is displayed by it's own colour. The legend above the graph is also showing all the currently plotted frequencies. Which frequencies are shown inside the graph is determined by the checkboxes on the left side of the window. By pressing the buttons F1 to F8, frequencies can be turned on or off. All the frequencies are always measured, but only the selected frequencies will be plotted inside the graph. The "Scale" button will calculate a new optimum displaying scale for the graph, and it will redraw the graph with the new scales. The right X-value of the graph will be calculated to be 3 dB more than the maximum measured value. The left X-value of the graph will be calculated to be 12 dB less than the maximum measured value. The left Y-axis of the graph is showing the height in meters. The right Y-axis of the graph is showing the down-tilt from the transmitting antenna to the helicopter antenna.
The measurement window also has some buttons that control the measurement phase during the test. The vertical flight has three phases:
- Approach
- Measurement
- Selection
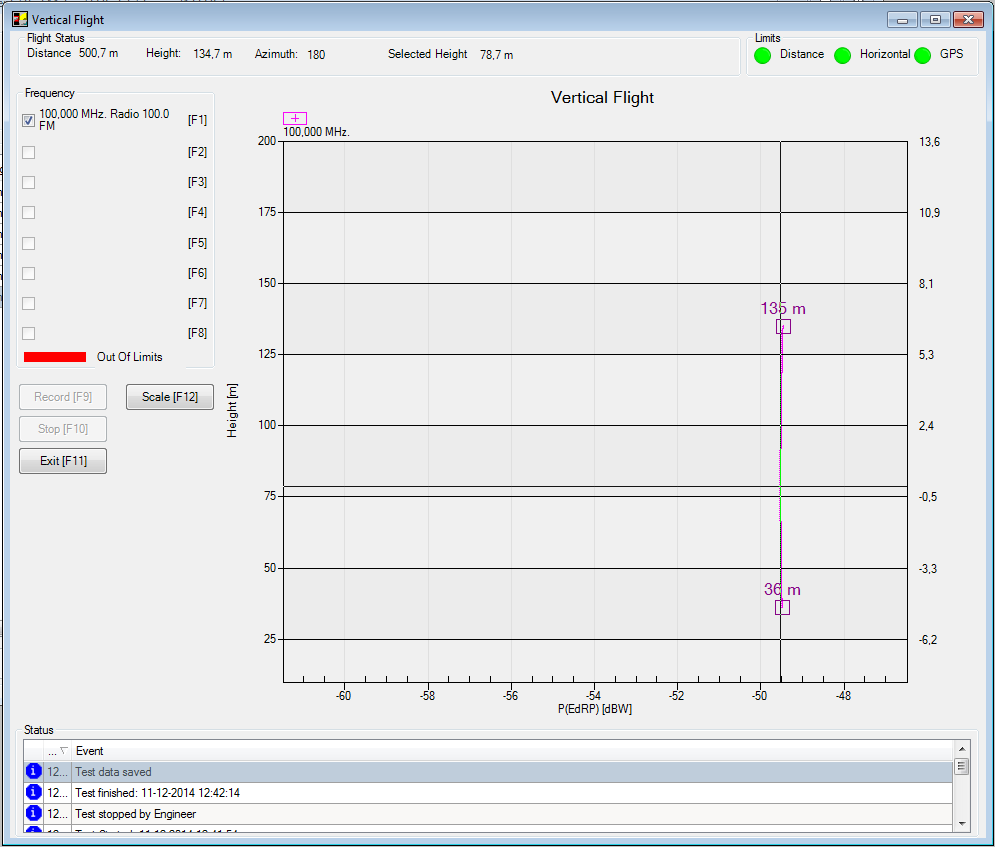
The vertical flight will always start in the Approach phase, this phase should be used to position the helicopter on the correct starting position. Based on the indication of the LEDs, the test-engineer can determine when the correct starting position has been reached. During the Approach phase, the graph will only show the last measured and calculated values for each frequency. When the correct starting position has been reached, the "Record" button should be pushed to enter the measurement phase. In the measurement phase all the measured and calculated ERP values for each frequency will be plotted in the graph. Each frequency will be plotted in its own colour, except when the helicopter is flying outside the specified margins, if that is the case, the frequencies will be drawn in red. The test-engineer can stop the measurement phase by pressing the "Stop" button. The measurement phase will automatically be ended when the helicopter reaches the specified stop distance.
When the vertical flight is in the selection phase, the test-engineer has the possibility to select the best measurement height for the circle flight. When the selection phase is entered, the graph will get a selection line. The selection line can be moved with the mouse (by clicking on any frequency in the graph) or with the keyboard. The PageUp key and the Up-Arrow button will move the selection line to the stop height. The PageDown key and the Down-Arrow button will move the selection line to the start height. When the selection line is moved, the selected height in the top of the window will be updated to the selected height. When the test-engineer has selected the correct height, the "Exit" button should be pressed. This will end the test, and will deinitialise all the used equipment.
The vertical flight can be stopped from any phase by pressing the "Exit" button
After completion of the test, the test-engineer can view the data of the measurement in the graph by selecting the test and pressing the "Info" button in the location screen. The same window will appear as during the test, but without the "Record" and "Stop" buttons. Also on this window the available frequencies can also be shown or hidden by selecting the checkboxes on the left part of the window.
Circle Flight[edit]
After the site survey has been performed and the location and frequency files have been created. the details of the circle flight have to be entered before the actual test is commenced. So from the Test pull down menu the user selects the appropriate test by selecting:
-
 Test
Test
-
 Antenna Diagram
-
 Circle flight
-
-
-
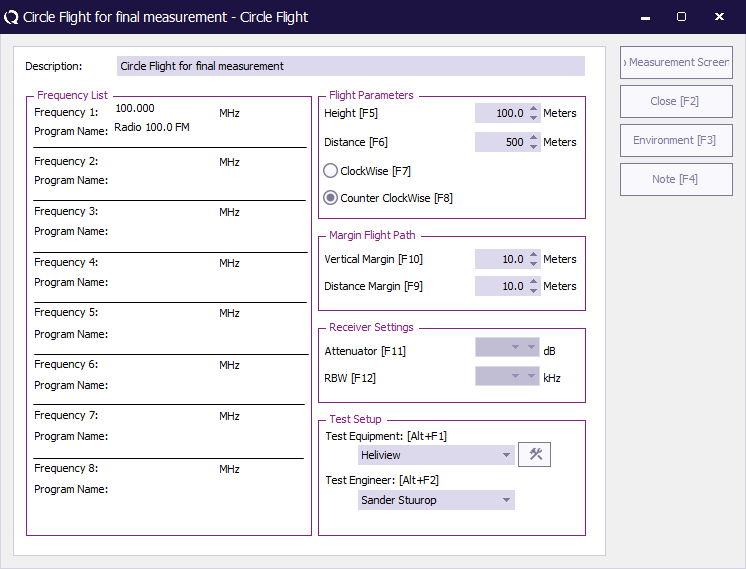
A window will be shown where the test-engineer has the possibility to select an already configured Test Setup File (TSF) for a circle flight for this location. When a configured test is selected, the "Ok" button can be pressed, and the test configuration will be opened. If a new configuration has to be made the "New" button can be pressed, which will create a new TSF file for the circle flight. The following screen will appear. This is the input screen for the Test Setup File (TSF) for the circle flight.
On the left side of the screen an overview of the selected frequencies is presented. Another four frames respectively represent the information on the flight path (approach) of the test, the margins of the flight path, the receiver settings and the test setup. The following parameters have to be configured:
- Description: A descriptive name for the circle flight configuration
- Height: the height (above ground level) at which the helicopter should fly. This value will automatically be updated to be the last selected height from the last vertical flight.
- Distance: the optimum distance from the antenna tower at which the helicopter should fly. This value will automatically be updated to be the last selected distance from the last propagation flight.
- Clockwise or Counter Clockwise: the selection of the suggested flying direction around the tower. This information is used to correctly display information on the pilot interface.
- Vertical margin: the maximum accepted vertical deviation of the helicopter opposed to the optimal flight path. This value will be used to show the margins on the pilot interface display to the helicopter pilot. Also when data is measured when the helicopter is outside the valid margins, the data will be plotted in red in the graphs.
- Distance margin: the maximum accepted distance deviation of the helicopter opposed to the optimal distance to the antenna tower. This value will be used to show the margins on the pilot interface display to the helicopter pilot. Also when data is measured when the helicopter is outside the valid margins, the data will be plotted in red in the graphs.
- Attenuator: The to be used attenuation setting on the measurement receiver
- RBW: The to be used RBW setting on the measurement receiver
- Test Equipment: The configuration of the test-site which has to be used during the measurements
- Test Engineer: The test-engineer who will perform the measurements
All parameters should be configured, before the measurement can be started.
The following buttons are available:
- Go To Measurement Screen: Start the measurement
- Close: Close this window without starting the measurement
- Environment: Some additional data can be entered like: Temperature, Humidity and Pressure.
- Note: Any kind of information can be entered that could be relevant to this measurement. This note is also available during and after the test.
When all parameters are configured correctly, the configuration of this measurement can be saved as a TSF file. This can be done by selecting from the menu: File > Save TSF. The configuration will be stored in a TSF file with a filename which is the same as the given description. When the configuration is saved to a TSF file, the same configuration can easily be selected the next time a circle flight should be started.
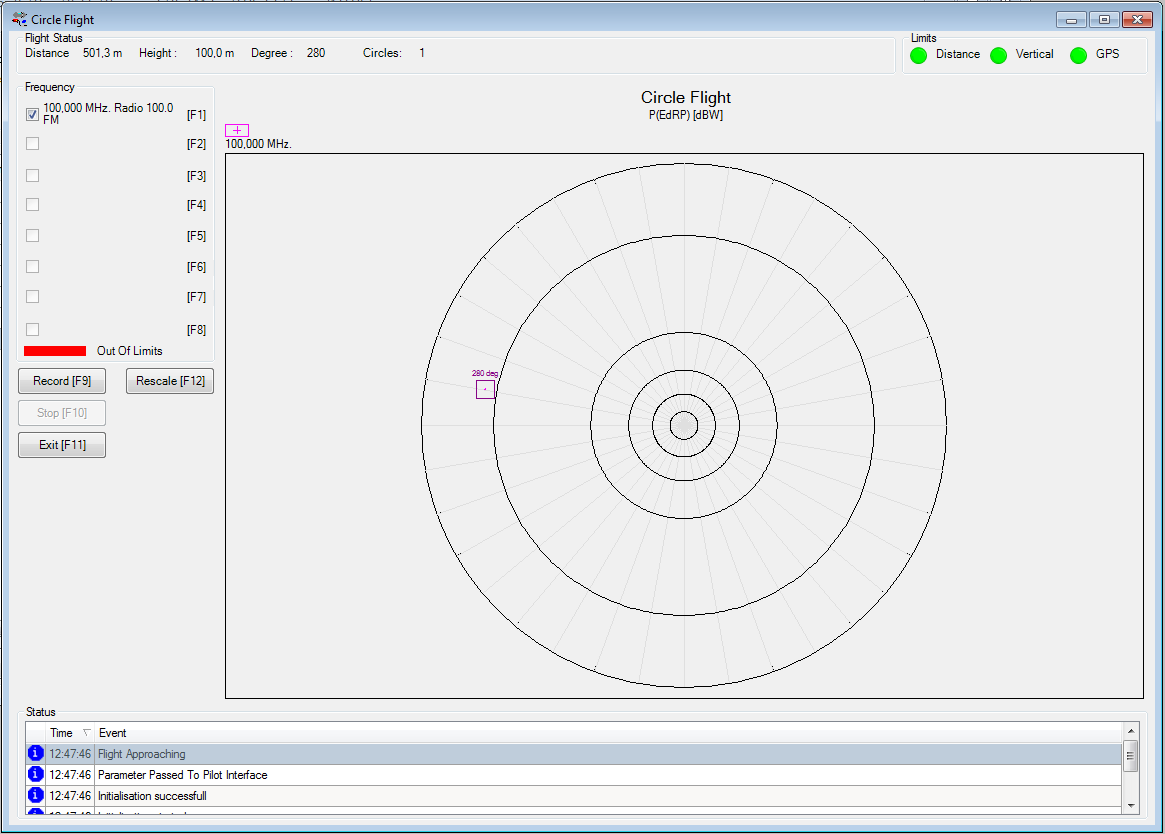
When a circle flight test is started, first an integrity test is performed. When the integrity test was succesfull the folowing screen will appear:
This window is displaying the current status of the measurement. All important real-time information is displayed on this window during the measurement:
- Distance: The current distance of the helicopter to the antenna tower
- Height: The current height of the antenna below the helicopter compared to the ground level
- Degree: The current angle between the helicopter and the antenna tower
- Limits: The LEDs are indications of a current error situation:
- Horizontal: the helicopter is within the horizontal margins
- Vertical: the helicopter is within the vertical margins
- GPS: A correct and accurate GPS signal is received
- Status: A list of all informational, warning and error messages during a test. Several warnings and errors can be displayed in this list
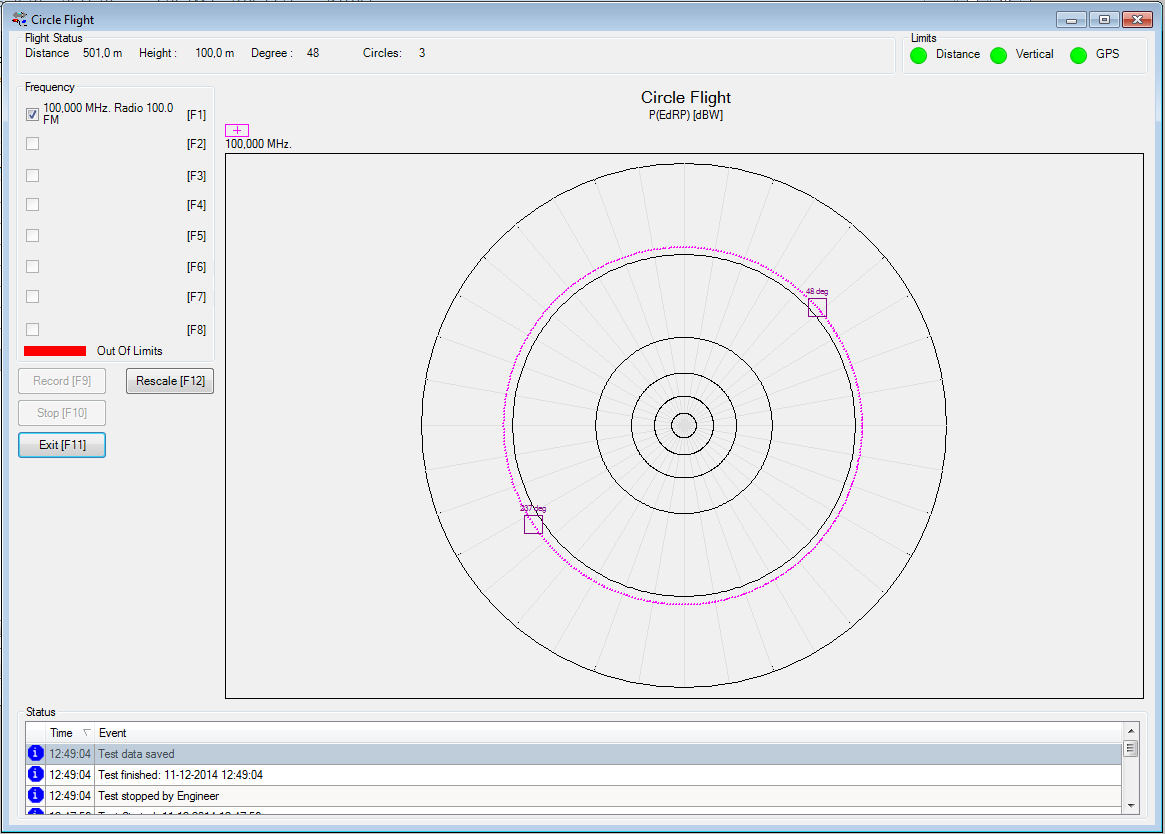
The biggest part of the screen is occupied by the graph which contains the measured and calculated ERP power for each measured frequency. Each line in the graph for a frequency is displayed by it's own colour. The legend above the graph is also showing all the currently plotted frequencies. Which frequencies are shown inside the graph is determined by the checkboxes on the left side of the window. By pressing the buttons F1 to F8, frequencies can be turned on or off. All the frequencies are always measured, but only the selected frequencies will be plotted inside the graph. The "Rescale" button will calculate a new optimum displaying scale for the graph, and it will redraw the graph with the new scales. The outer polar graph value will be calculated to be 3 dB more than the maximum measured value. The middle polar graph value will be calculated to be around 40 dB less than the maximum measured value.
The measurement window also has some buttons that control the measurement phase during the test. The circle flight has three phases:
- Approach
- Measurement
- Viewing
The circle flight will always start in the Approach phase, this phase should be used to position the helicopter on the correct starting position. Based on the indication of the LEDs, the test-engineer can determine when the correct starting position has been reached. During the Approach phase, the graph will only show the last measured and calculated values for each frequency. When the correct starting position has been reached, the "Record" button should be pushed to enter the measurement phase. In the measurement phase all the measured and calculated ERP values for each frequency will be plotted in the graph. Each frequency will be plotted in its own colour, except when the helicopter is flying outside the specified margins, if that is the case, the frequencies will be drawn in red. The test-engineer can stop the measurement phase by pressing the "Stop" button.
When the circle flight is in the viewing phase, the test-engineer has the possibility to interpret the data, and to still turn on or off some frequencies. When the test-engineer is ready, the "Exit" button should be pressed. This will end the test, and will deinitialise all the used equipment.
The circle flight can be stopped from any phase by pressing the "Exit" button.
After completion of the test, the test-engineer can view the data of the measurement in the graph by selecting the test and pressing the "Info" button in the location screen. The same window will appear as during the test, but without the "Record" and "Stop" buttons. Also on this window the available frequencies can be shown or hidden by selecting the checkboxes on the left part of the window.
Pilot Interface[edit]
The pilot interface is a small software program that is designed to give flying directions to a helicopter pilot. The pilot interface program is communicating with the Antenna diagram module of the RadiMation software to give the helicopter pilot correct and accurate information. The pilot interface program also is connected to a (D)GPS receiver to get accurate information of the current position of the helicopter. The pilot interface program can have four different states:
- Standby
- Propagation Flight
- Vertical Flight
- Circle Flight
Depending on the actions taken by the test-engineer who is controlling the RadiMation software the correct display state is shown to the helicopter pilot. The pilot interface program has no keyboard or mouse control, it is designed to only be controlled by the RadiMation software.
RadiMation device driver[edit]
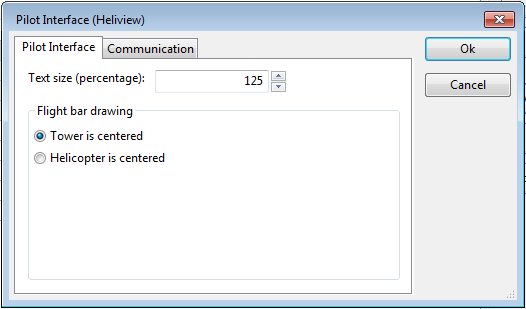
A device driver is available in RadiMation® that controls the Pilot Interface. And this device driver also allows that text-size and the drawing of the flight bars can be configured.
Standby[edit]
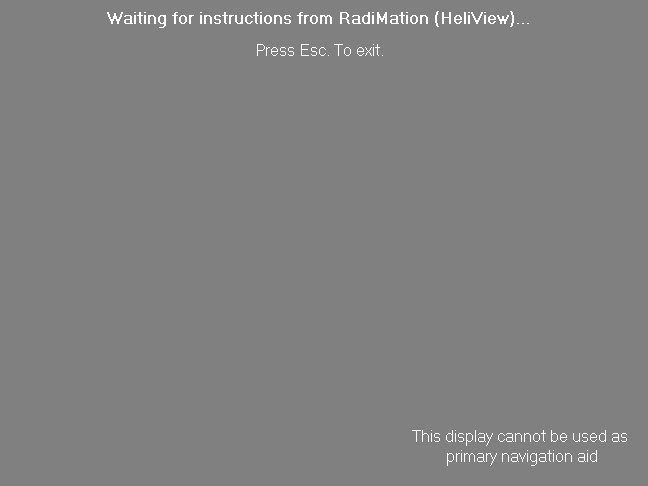
When no measurement is active, the following pilot interface screen is available.
No directions are given by the RadiMation or pilot interface software to the helicopter pilot. The test-engineer and the helicopter pilot have to discuss how to fly to a destination. This situation often occurs between measurements, and also during the flight from the airport to the antenna tower, and back again.
Propagation Flight[edit]
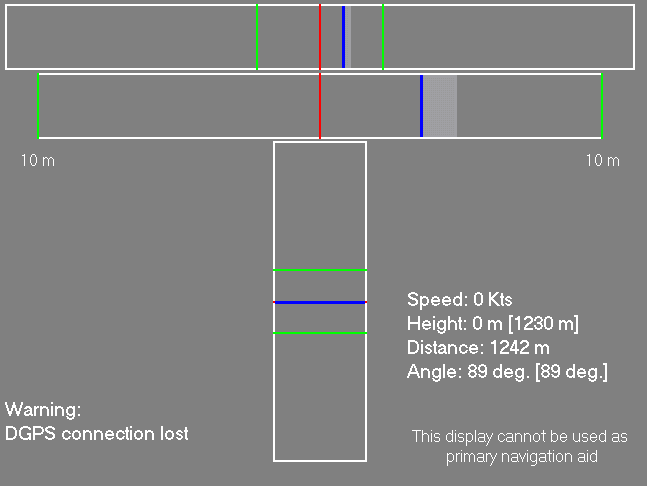
During a propagation flight, the pilot interface will show a window like:
The two indication bars on top of the screen are the current indication of the horizontal deviation from the optimal flight path. The two indication bars display the same information, but the lower bar is only displayed with a higher resolution. When in the top indication bar the blue line is outside the valid margins (the green lines), there will be no blue line indication in the higher resolution bar. The vertical indication bar in the lower half of the screen is the vertical deviation of the optimal flight path. The center of the bars (the red-lines) is the helicopter itself. The blue line is the optimal flight path. The green lines are the indications of the borders of the accepted margins of the deviation of the optimal flight path. During movement of the helicopter, the blue lines will show a movement trail, to give the helicopter pilot a good indication of the speed and direction of the movement. If some error conditions are available, a warning will be displayed in the lower left part of the screen. In the example above, a warning is given that the data from the DGPS is lost or is not accurate enough. The lower right part of the screen is used to display the current values of:
- Speed of the helicopter
- Height of the helicopter
- Distance to the antenna tower
- Angle of the helicopter compared to the antenna tower
The actual real-time values are displayed, and when optimal flight paramers are known, these values are shown within brackets behind the actual values.
Vertical Flight[edit]
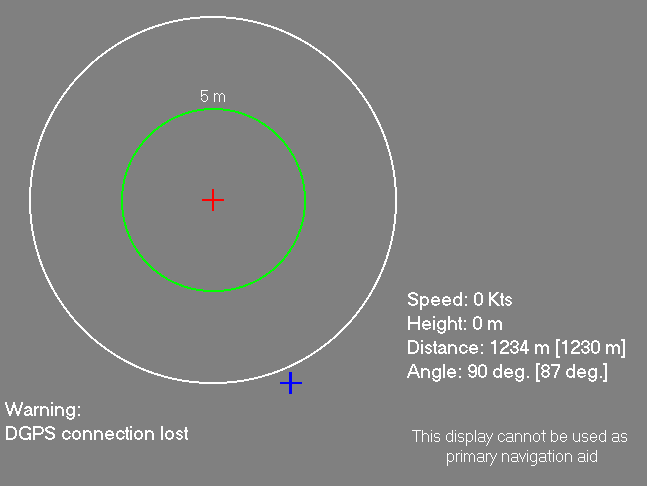
During a vertical flight, the pilot interface will show a window like:
On this window, the helicopter is indicated by the red cross. The optimal location to perform the vertical flight is indicated by the blue cross. The location of the tower is not shown in this window. The green circle is the border of the accepted margins of the vertical flight. As long as the blue cross stays in the green circle, the measurement will be inside the accepted margins. During movement of the helicopter, the blue cross will show a movement trail, to give the helicopter pilot a good indication of the speed and direction of the movement. If some error conditions are available, a warning will be displayed in the lower left part of the screen. In the example above, a warning is given that the data from the DGPS is lost or is not accurate enough. The lower right part of the screen is used to display the current values of:
- Speed of the helicopter
- Height of the helicopter
- Distance to the antenna tower
- Angle of the helicopter compared to the antenna tower
The actual real-time values are displayed, and when optimal flight parameters are known, these values are shown within brackets behind the actual values.
Circle Flight[edit]
During a circle flight, the pilot interface will show a window like:
The two indication bars on top of the screen are the current indication of the horizontal deviation from the optimal flight path. The two indication bars display the same information, but the lower bar is only displayed with a higher resolution. When in the top indication bar the blue line is outside the valid margins (the green lines), there will be no blue line indication in the higher resolution bar. The vertical indication bar in the lower half of the screen is the vertical deviation of the optimal flight path. The center of the bars (the red-lines) is the helicopter itself. The blue line is the optimal flight path. The green lines are the indications of the borders of the accepted margins of the deviation of the optimal flight path. During movement of the helicopter, the blue lines will show a movement trail, to give the helicopter pilot a good indication of the speed and direction of the movement. If some error conditions are available, a warning will be displayed in the lower left part of the screen. In the example above, a warning is given that the data from the DGPS is lost or is not accurate enough. The lower right part of the screen is used to display the current values of:
- Speed of the helicopter
- Height of the helicopter
- Distance to the antenna tower
- Angle of the helicopter compared to the antenna tower
The actual real-time values are displayed, and when optimal flight paramers are known, these values are shown within brackets behind the actual values.
