File:HV-LVAttenuationGainEUTCalibrationResultGraph.png

Size of this preview: 752 × 600 pixels. Other resolutions: 301 × 240 pixels | 1,013 × 808 pixels.
Original file (1,013 × 808 pixels, file size: 67 KB, MIME type: image/png)
Summary
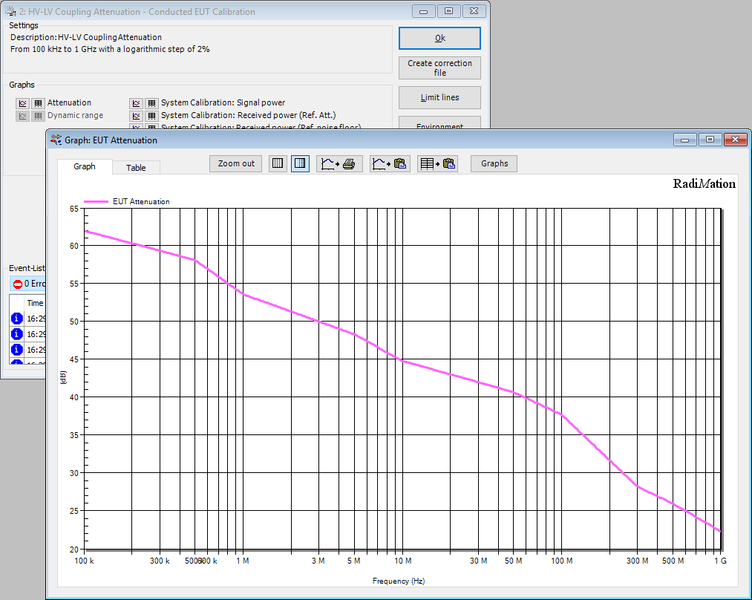
The window that is shown to present the result of the Attenuation/Gain EUT calibration, also showing the EUT Attenuation graph. In this example specifically for the HV-LV Attenuation measurement.
File history
Click on a date/time to view the file as it appeared at that time.
| Date/Time | Thumbnail | Dimensions | User | Comment | |
|---|---|---|---|---|---|
| current | 14:49, 10 April 2019 | | 1,013 × 808 (67 KB) | Joro (talk | contribs) | The window that is shown to present the result of the Attenuation/Gain EUT calibration, also showing the EUT Attenuation graph. In this example specifically for the HV-LV Attenuation measurement. |
- You cannot overwrite this file.
File usage
The following page links to this file: