RadiMation Application Note 103
How to determine the antenna diagram of an antenna[edit]
This Application Note will explain how measurements can be done in RadiMation® to determine the antenna diagram of an antenna on one or more frequencies. RadiMation® is not designed to perform antenna diagram measurements, but due to its flexibility and versatility it is easily possible to perform this type of measurement.
Overview[edit]
To determine the antenna diagram of an antenna, the effectiveness of the antenna should be measured depending on the angle of the antenna. For clarity we will call this antenna the EUT-Antenna in this application note, as it very often is the antenna that is part of an EUT.
To measure the effectiveness of the EUT-antenna a second antenna is needed. One of the two antennas is used as a transmit antenna, and the other antenna is used as a receive antenna and connected to a spectrum analyser to measure the amplitude of the received signal. It is not important if the EUT-antenna is used as a transmitting antenna or as a receiving antenna. The measurement procedure to measure the antenna diagram of the EUT-antenna is the same in both situations. It is however important that the EUT-antenna is positioned in the center of a turntable, and that the second antenna is positioned on a fixed location relative to the turntable.
In this application note we assume that the EUT-antenna is used as a transmitting antenna. A fixed and stable signal should be applied to the antenna. This can be a signal generator, or the EUT that contains the EUT-antenna that generates a stable signal. The second antenna is then connected to a spectrum analyser, which is used to measure the variation in the measurement result caused by the rotation of the turntable angle and thus the EUT-antenna angle. As the EUT-antenna diagram is often used as a relative measurement, the absolute measurement value is often not important. The most important information is the variation (in dB) depending on the angle of the EUT-antenna.
Hardware configuration and preparations[edit]
The EUT-antenna should be placed on the turntable, and it should be connected to a signal generator that generates a stable signal on the desired frequency. The receiving antenna can be placed on another location outside the turntable area, and should be connected to the spectrum analyser.
It is required that the used RadiMation® license contains the Radiated Emission module.
In RadiMation®, a testsite should be used that contains the following devices
- Turntable: the turntable on which the EUT-antenna is positioned
- Antenna: the second antenna (not being the EUT-antenna) that is used in the measurement setup.
- Spectrum analyser: the spectrum analyser that is connected to the receiving antenna
- (optional) cables: to correct for cable losses between the receiving antenna and the spectrum analyser
- (optional) preamplifier: an external preamplifier between the receiving antenna and the spectrum analyser to amplify the received signal
All corrections that are selected in the selected devices will be taken into account when the measurement results are shown. The EUT-antenna is not included in the testsite, because the EUT-antenna is the component that is being tested, and this is is represented by the EUT in RadiMation®.
Also the signal generator that is used to generate a fixed and stable signal is not included in the testsite, as it is auxiliary equipment that is used to stimulate the EUT-antenna. That signal generator should be configured manually to generate a suitable signal.
Before we can start the real measurements a new EUT that represents the EUT-antenna should be created. This EUT file is also used to store and maintain the measurements results of the measurements on the EUT-antenna.
In this application note we used a virtualized setup, which uses the 'Virtual Spectrum Analyser' and the 'Virtual Turntable'. This virtualized setup has a signal on 93.0 MHz, which fluctuates depending on the turntable angle. This virtualized setup can be used to demonstrate the capability of RadiMation® to determine the antenna diagram. This same virtualized setup and the following measurements can be performed on any RadiMation® installation.
Frequency measurement to determine the frequency[edit]
First we have to configure a Multiband Radiated Emission test. This test can be configured using the menu:
-
 Tests
Tests
-
 Radiated Emission
-
 Multiband
-
-
-
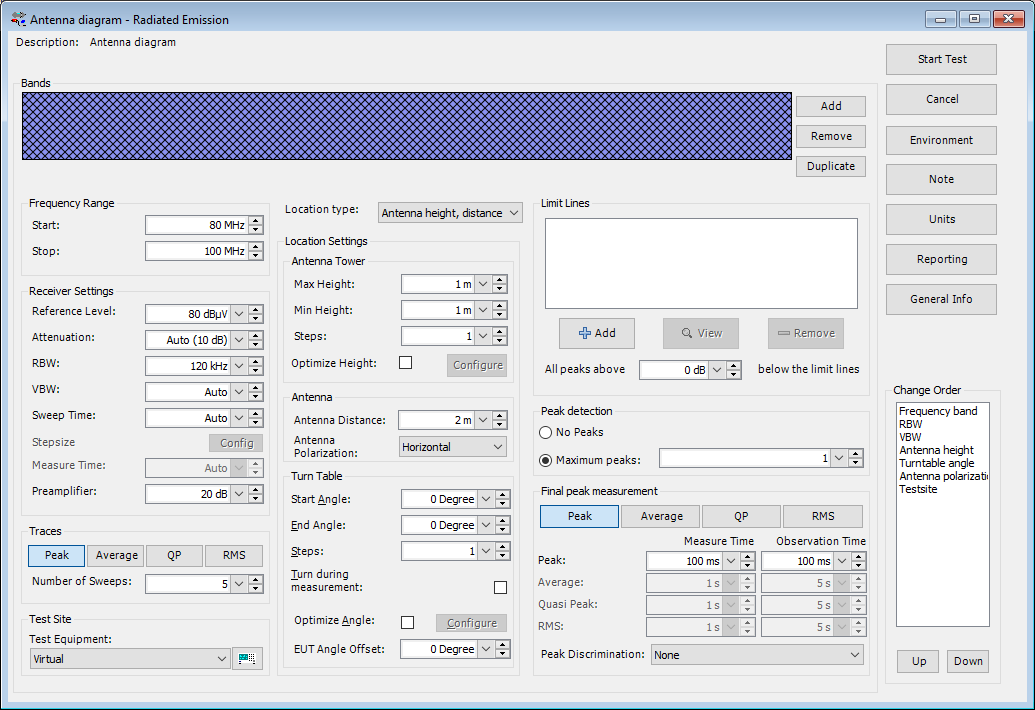
In the Multiband Radiated Emission test configuration, the following configurations should be made:
- Select the applicable Frequency Range of the EUT-Antenna that should be measured. If a signal generator is used to generate a fixed and stable signal to the EUT-antenna, the generated signal frequency of the signal generator should also fall within the applicable frequency range.
- Configure the Receiver Settings as desired to perform an optimal measurement of the received signal.
- For the Traces it is best only select Peak as it results in the fastest measurement.
- Select the TestSite that was already prepared and contains the used devices in the measurement setup.
- For the Location type select the Antenna height, distance, polarization and angle option.
- In the Antenna Tower and Antenna sections, select the actual height and distance of the EUT-Antenna or the second antenna. Only selected a single Steps as only a measurement on a single height is necessary.
- In the Turn Table section, set the Start Angle and End Angle to the angle on which the highest gain of the EUT-antenna is expected. Only selected a single Steps as the procedure is started with a measurement on a single turntable angle.
- No Limit Lines are needed to be selected.
- In the Peak detection select a maximum of 1 peak, as we are at this moment only interested in a single peak frequency.
- For the Final peak measurement select the Peak detector, and select a 100 ms Measure Time and 100 ms Observation Time as we want to have very fast final measurement.
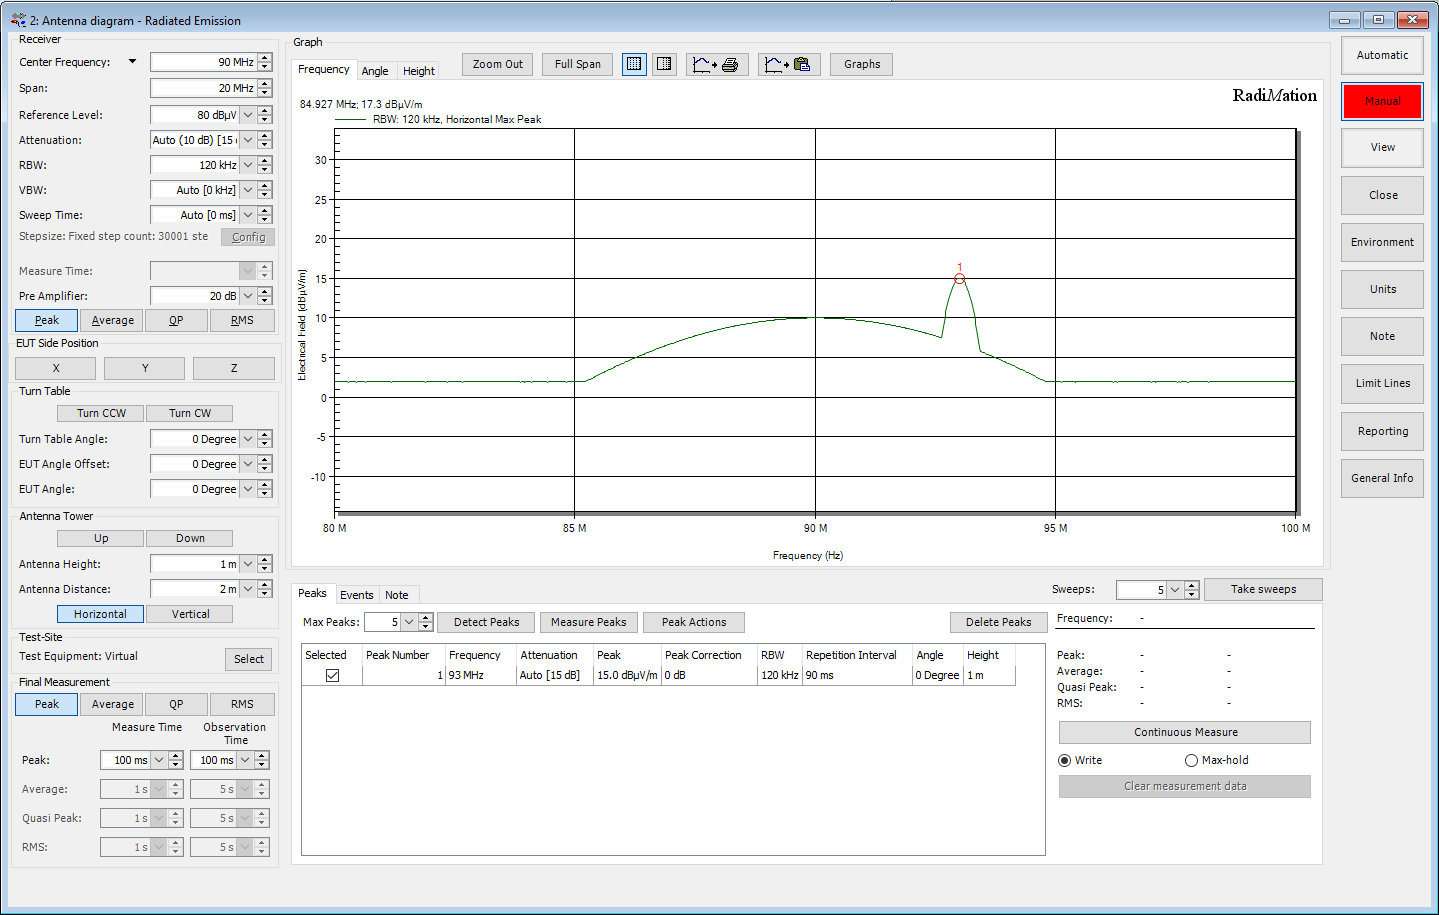
When the test is started, the measurement of the frequency range is performed, and the signal that is generated by the EUT-antenna will be measured and automatically detected as a peak. Ensure that the a peak is indeed detected and is correctly listed in the table of detected peaks. If another peak on another frequency should be measured, that peak can be selected by clicking with the mouse on the signal in the graph. RadiMation® will then automatically mark the clicked signal as a new peak to the list of detected peaks.
Performing the angle measurement[edit]
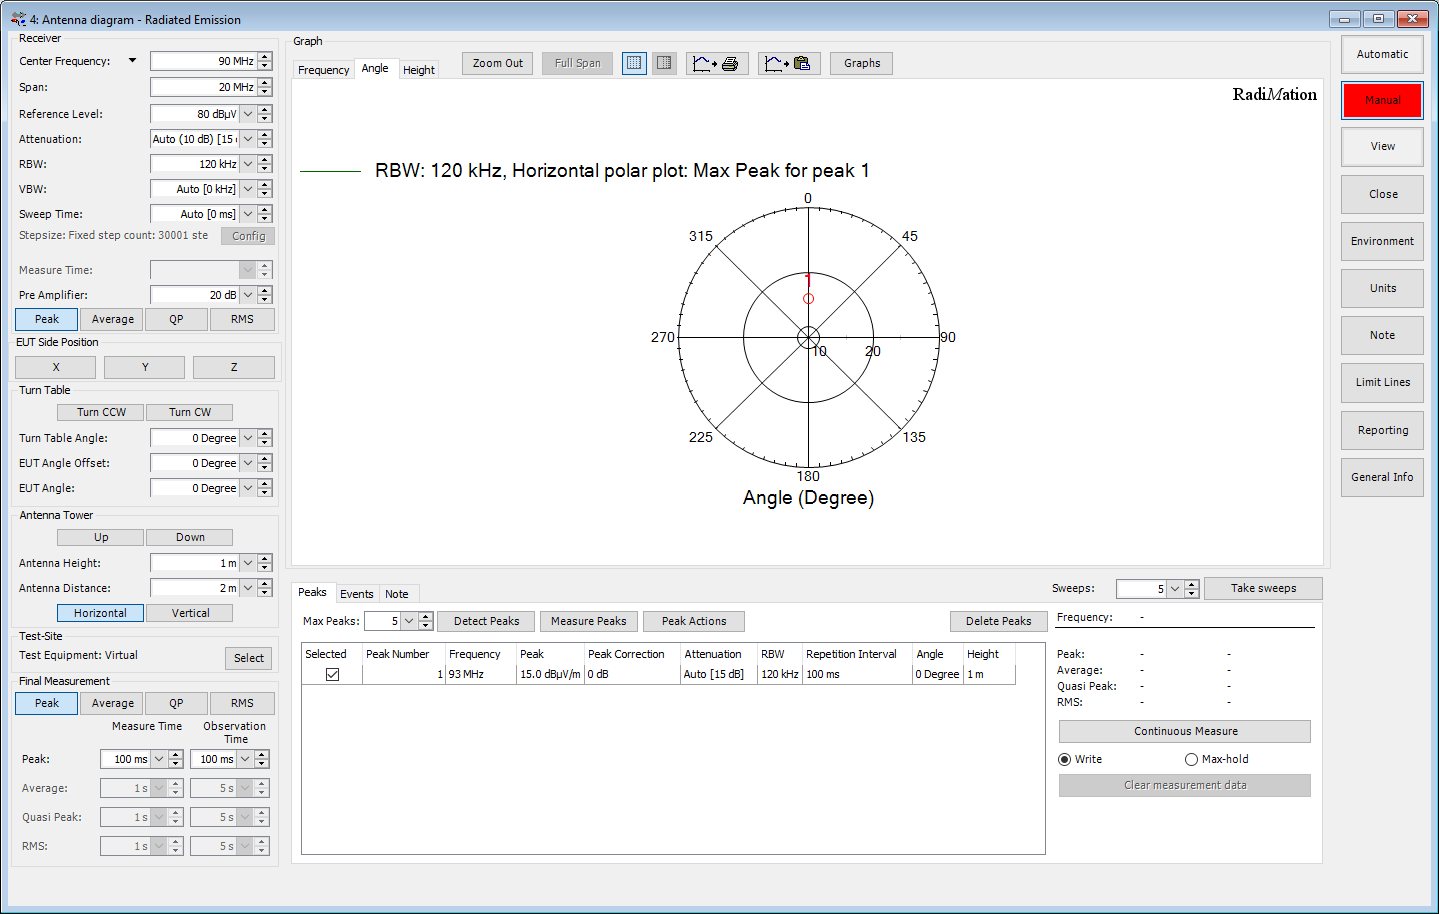
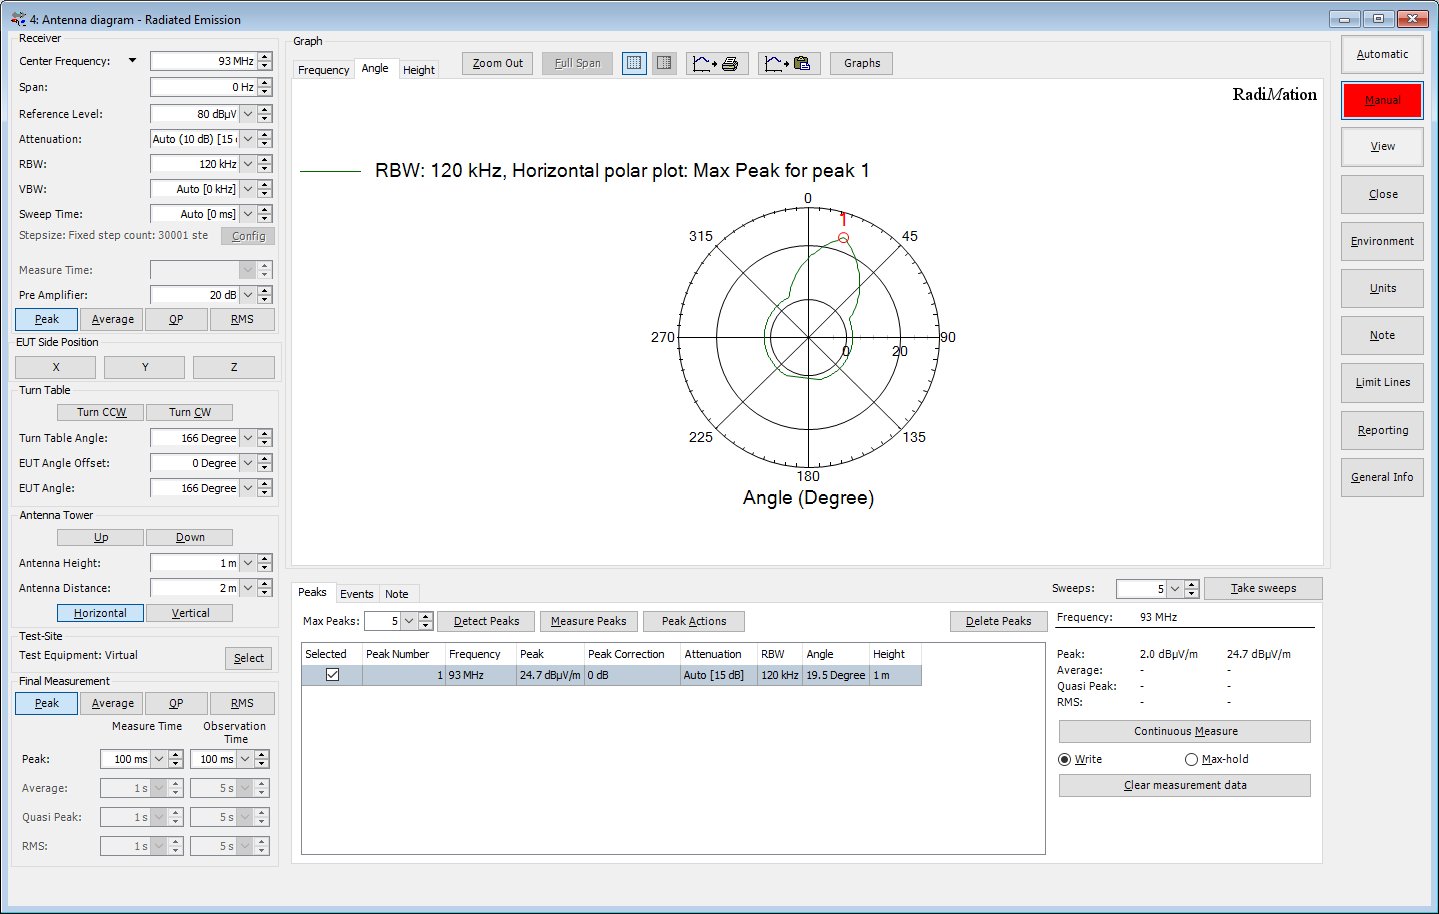
When the desired peak frequency it is selected, we can switch to the polar graph, by clicking on the Angle tab above the graph. The polar graph will show the amplitude and the turntable angle on which the selected peak was measured.
In the test window, now the measurement value depending on the turntable angle can be measured by activating the 'Continuous Measure mode'. The turntable angle can be changed by pressing the Turn CCW and Turn CW buttons. Pressing the Turn CCW or Turn CW button again while it is pushed, will stop the turning of the turntable. The actual turntable angle is visible in Turn Table Angle box. It best to to first turn to a starting turntable angle (for example -180 degrees), and then start the 'Continuous Measure mode' by pressing the Continuous Measure button. As long as the Continuous Measure button is shown in red, the 'Continuous Measure mode' is active. Then press the Turn CW which will start a complete turntable rotation. During the turntable movement, the continuous measurement on the selected peak will be performed and the measured data will be updated in the polar graph. The antenna diagram will be determined and shown in the polar plot dynamically.
For a good and accurate result it is important that fast measurements with the detector are performed when the turntable is turning. That is why it is best to select the Peak detector and a 100 ms Measure Time and 100 ms Observation Time in the Final Measurement section.
After the measurement is finished, press the Continuous Measure button again to stop the continuous measurement.
Multiple rotations of the turntable can be performed, however due to the speed of the turntable and spectrum analyser this very often results in measurements at slightly different turntable angles. If also the amplitude of the signal generator has changed, this can cause that the measurements are shown as a triangle wave. In this situation it is best to press the Clear measurement data button, which clears the measured data for the selected peak. This will cause that the polar plot becomes empty again, and a new measurement can be performed.
Under the Peak Actions button, there are several options that can be helpful:
- Peaks to Maximum: updates the selected peak to determine the maximum measured value and turntable angle. This also visually moves the peak marker to the maximum amplitude on the polar plot.
- Go To Peak Location: moves the turntable and the antenna tower to the location which are associated with the selected peak.
Multiple frequencies[edit]
Measurement of multiple frequencies and the antenna diagrams for those frequencies is also possible within the same test. Just select additional peaks in the frequency graph. The polar plot only can show the measurement results of a single selected peak. The information of the peak that has the selected checkbox in the list of detected peaks will be shown. When multiple peaks are added to the list of peaks, the rotation of the turntable with an activated 'Continuous measurement mode' should be repeated for each peak to determine the complete antenna diagram for those additional peaks.
Automated measurement of multiple frequencies[edit]
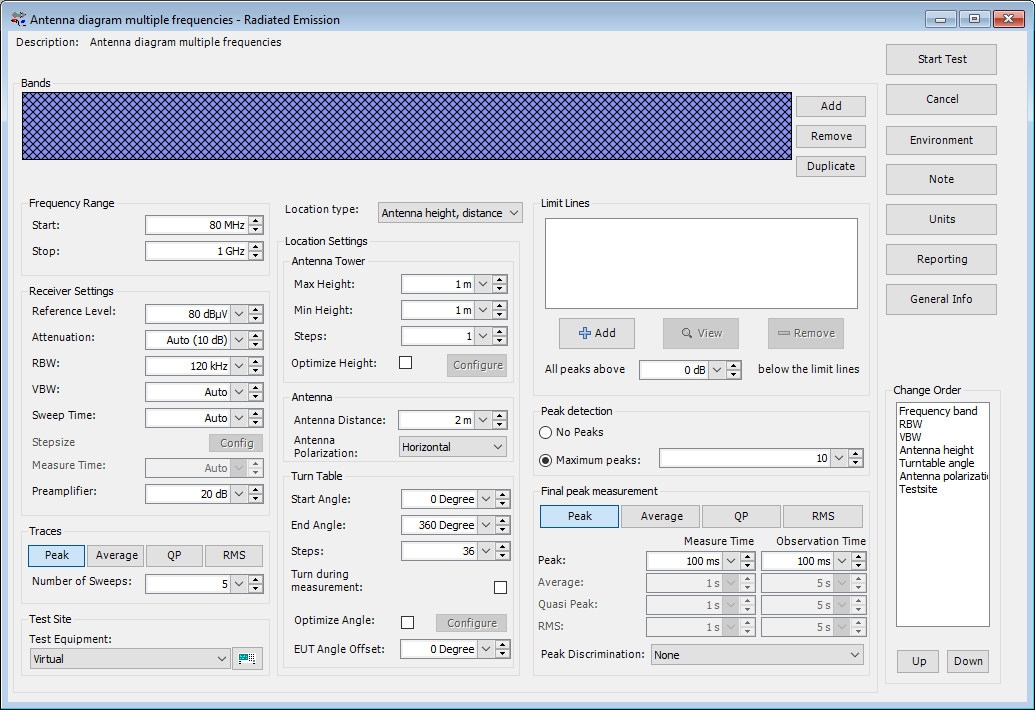
If multiple frequencies should be measured, it is also possible to perform the measurement automatically. The TSF can be configured to perform measurements on multiple angles. The measurement results at these different angles are also used to determine the results as it is shown in the polar plot. It is for example possible to perform a measurement on every 10 degrees of the turntable (36 Steps). The peaks can be automatically detected by RadiMation® or manually selected in the frequency graph. For all of the determined peaks a polar plot with a 10 degrees accuracy is directly available. This polar plot of the peaks can then always be further improved by performing the 'Continuous measurement mode' manually, for the relevant turntable range.
Reviewing the measurement results[edit]
The measurement results are automatically saved when the test is closed. When the test is reopened from the EUT File, it is possible again to switch to the polar plot graph on the Angle tab. The antenna diagram of the antenna for the selected peak frequency will then be shown again.
