RadiMation Application Note 128: Difference between revisions
| Line 77: | Line 77: | ||
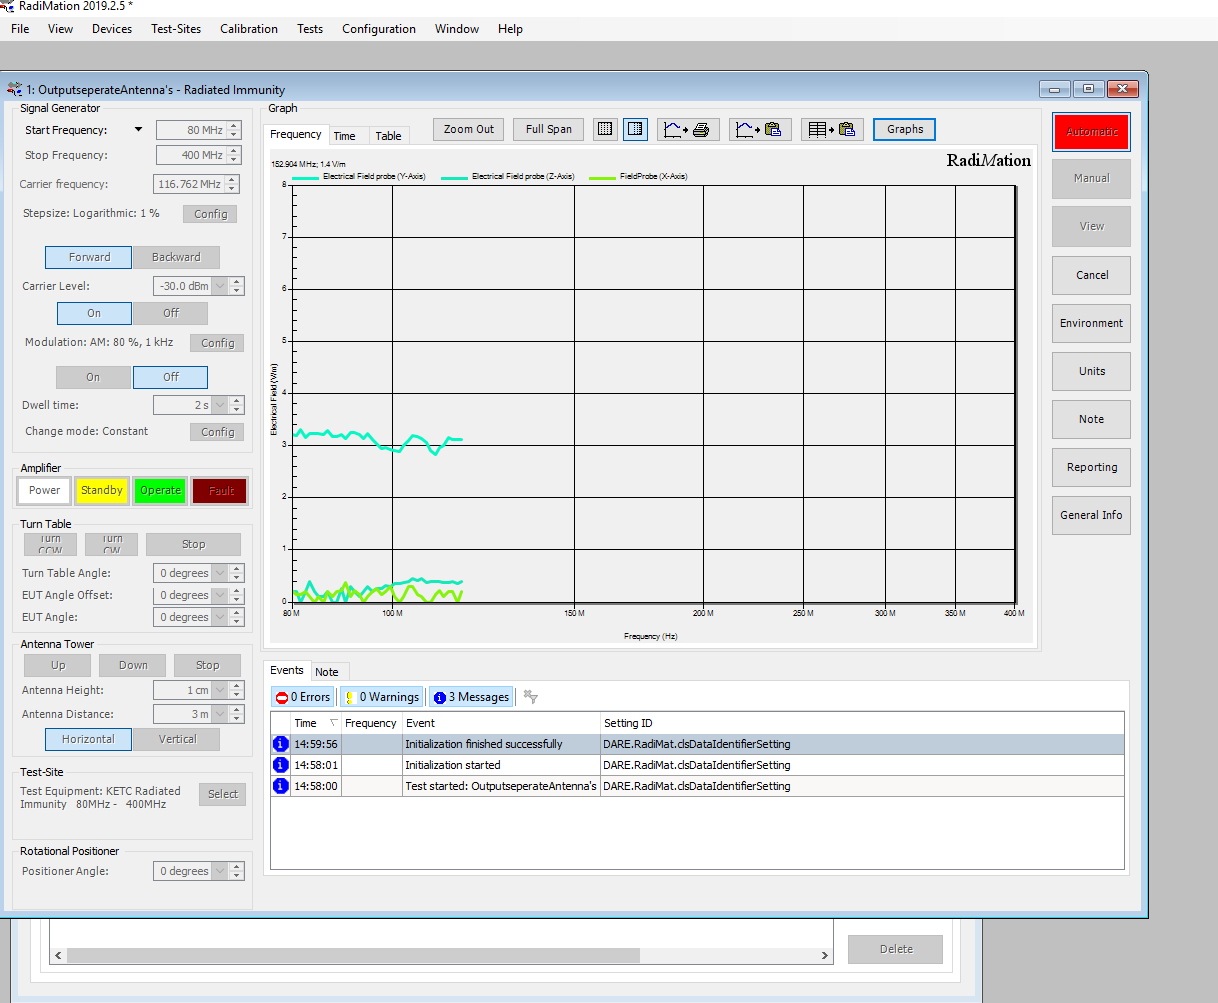
Run the test.You can add or remove the lines from the graph by clicking the graph button.Go to field and select the lines for the graphs of the x,y and z axis. | Run the test.You can add or remove the lines from the graph by clicking the graph button.Go to field and select the lines for the graphs of the x,y and z axis. | ||
[[File: | [[File:SelectTraxeforAxis.png]] | ||
When these lines are turned on you will be able to see the seperate values in one graph | When these lines are turned on you will be able to see the seperate values in one graph | ||
Revision as of 14:40, 6 January 2020
Reading the output value of single antenna's separately of a isotropic probe[edit]
In this application note we explain how you can output the individual value's of the antenna's of a isotropic probe.
Overview[edit]
RadiMation usually displays the iso-tropic value of a probe. In some cases it is also possible to read the output of the individual antenna's.
If the hardware supports it, Radimation can be set up to read these individual values. In this document we will show how to set this up.
Set up in RadiMation[edit]
To set this up in Radimation you need to create a separate driver per antenna. You can do this by going to:
Configuration -> Configuration -> Device Drivers Go to Field Sensors
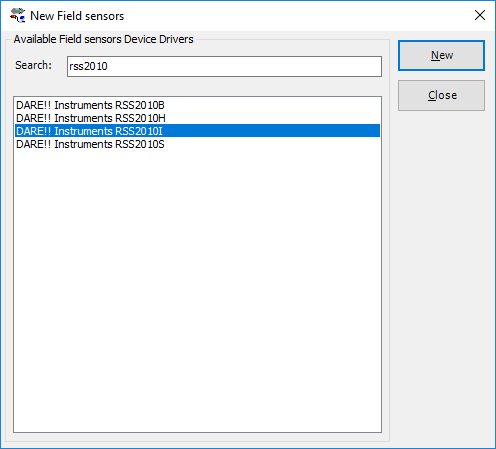
Add a driver for your field probe (We use a RSS2010I here, keep in mind this is also possible with other models. Check in the driver's advanced page if you see a setting for the Direction)
Rename it and add the name of the axis.
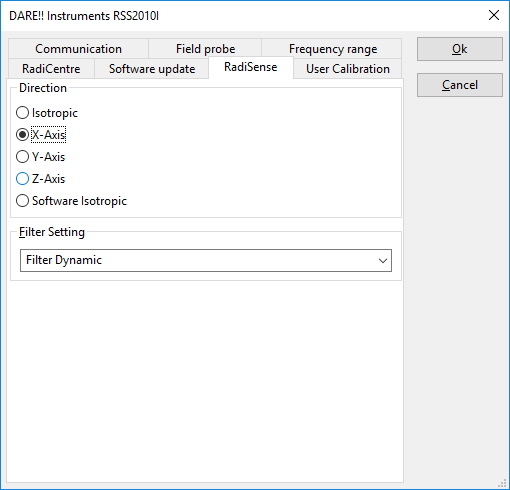
To make sure that you see the values of the x-axis when using this driver, go to advanced.
In the case of the RSS the tab is RadiSense. Here you can select the antenna used to read the values from.
Now that you have don this, repeat these steps for the other two axis so that you have a separate driver for all different axis.
Reading the values of the separate axis and add the output to a test[edit]
Now that we have made the drivers we will show an example how you can use them in conjunction with a Radiated immunity test. To do this you need to do the following steps.
Add the probes to your test-site[edit]
Open your test-site by going to:
Test-Sites
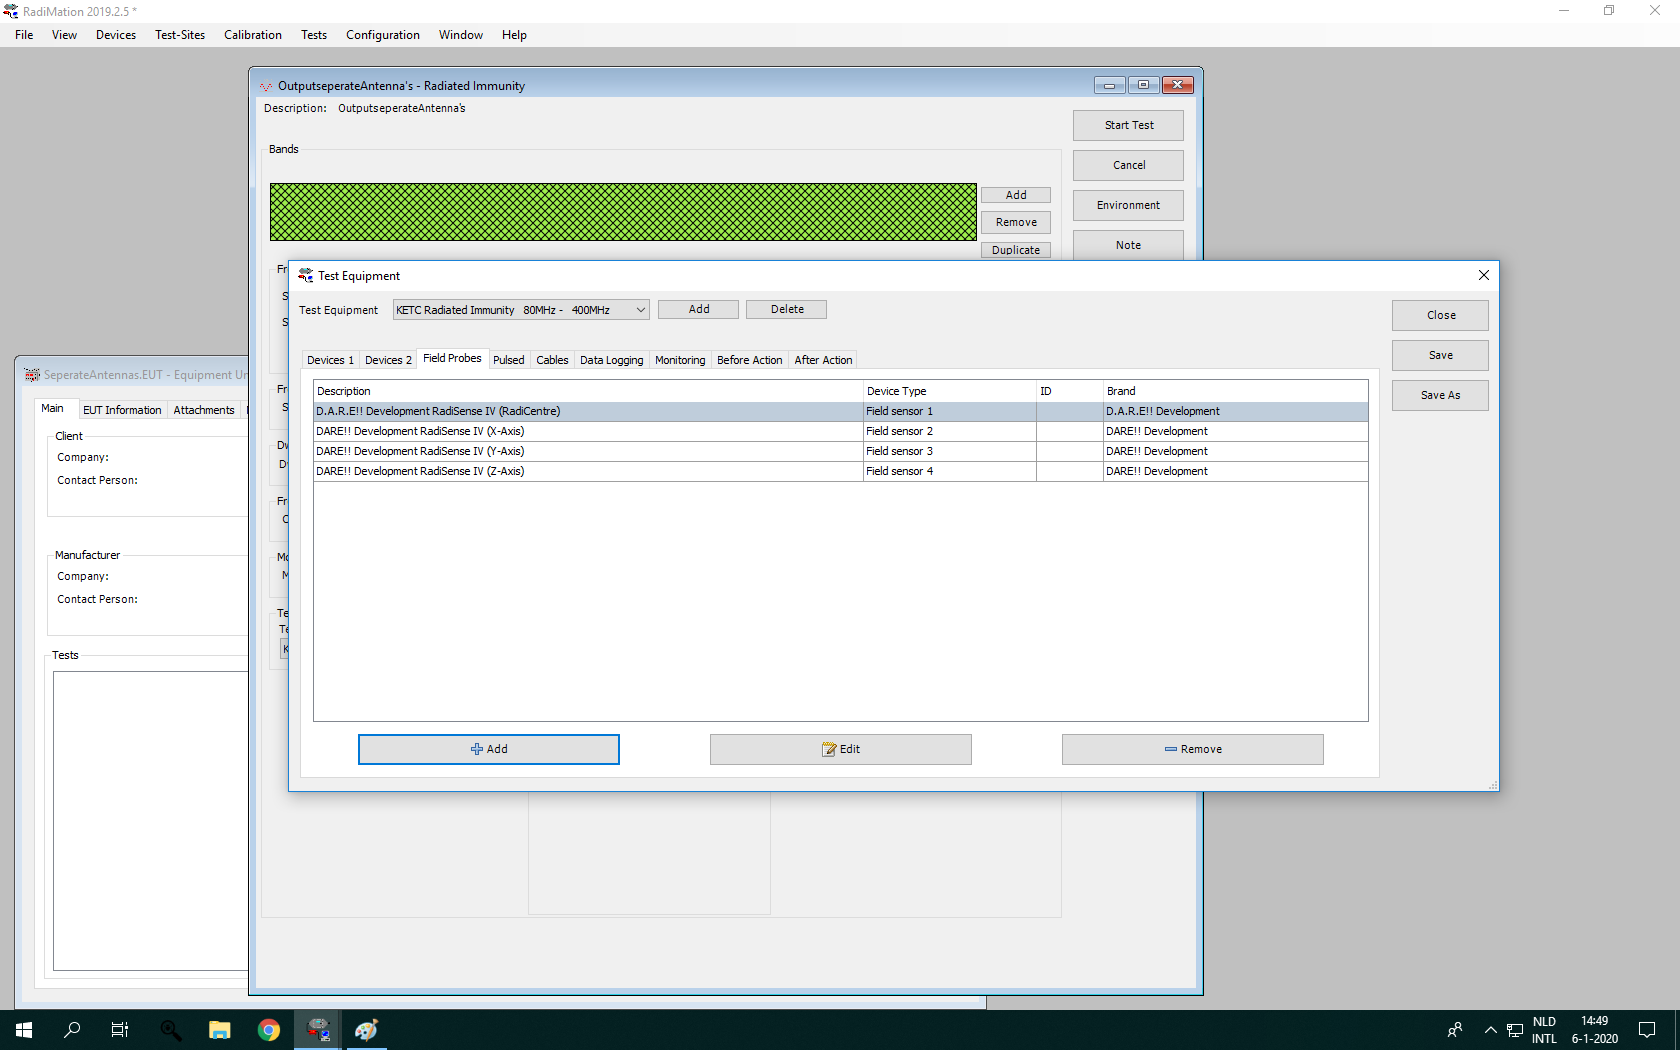
Find your test site and open it Go to the tab "probes" and add the drivers we have just created here (Remember the probe number, you will need this later on. This is the number behind Field Sensor)
Now that we have created the probes and added them to the test-site they are available for RadiMation to be used during test
Use the probes in a test[edit]
When all steps before have been executed successfully you can now add the probes to the test that you want. Make a new EUT and open or make a new TSF.
In this example we make a Radiated Immunity test. To make the test go to "tests/Radiated Immunity/MultiBand" You can make a new tsf or open a existing one.
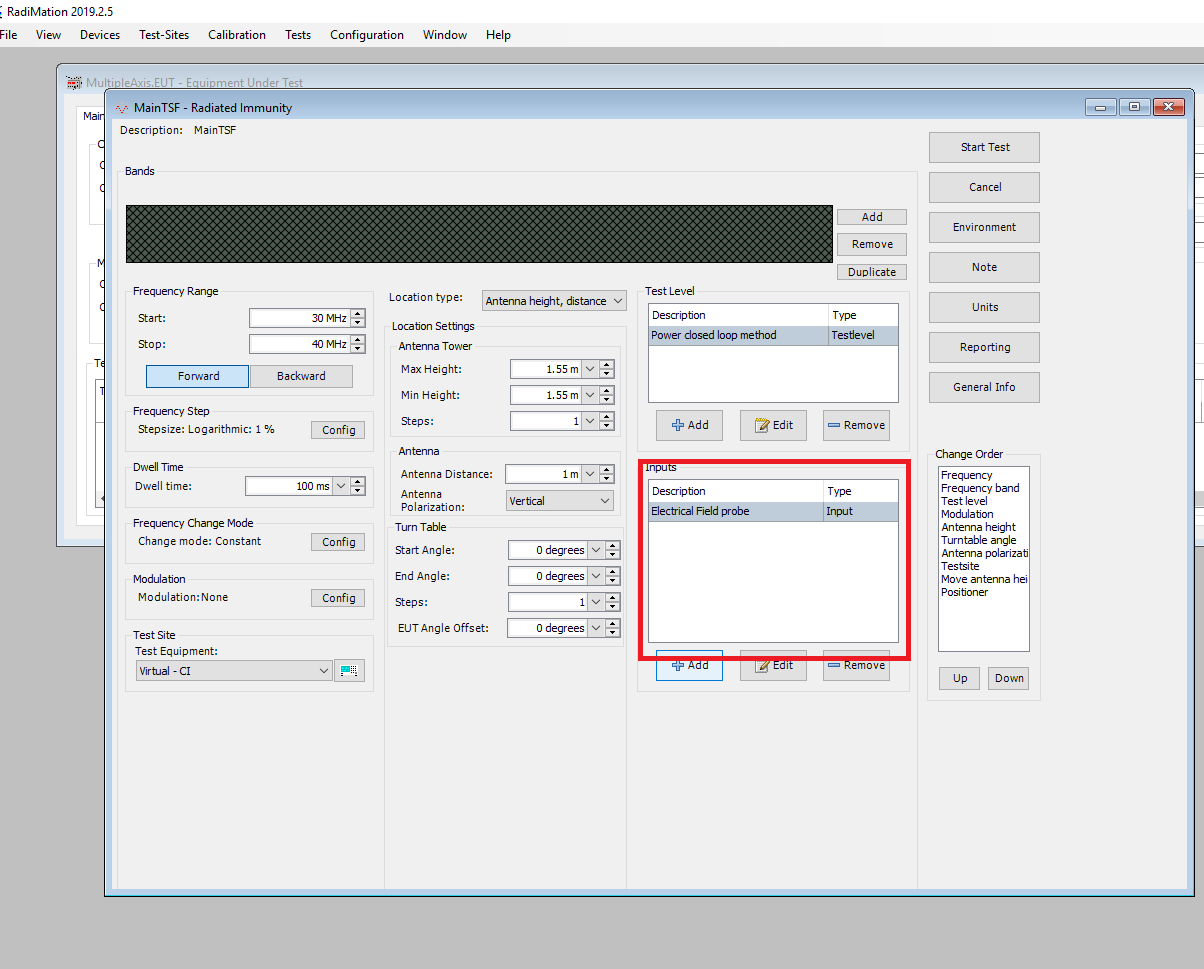
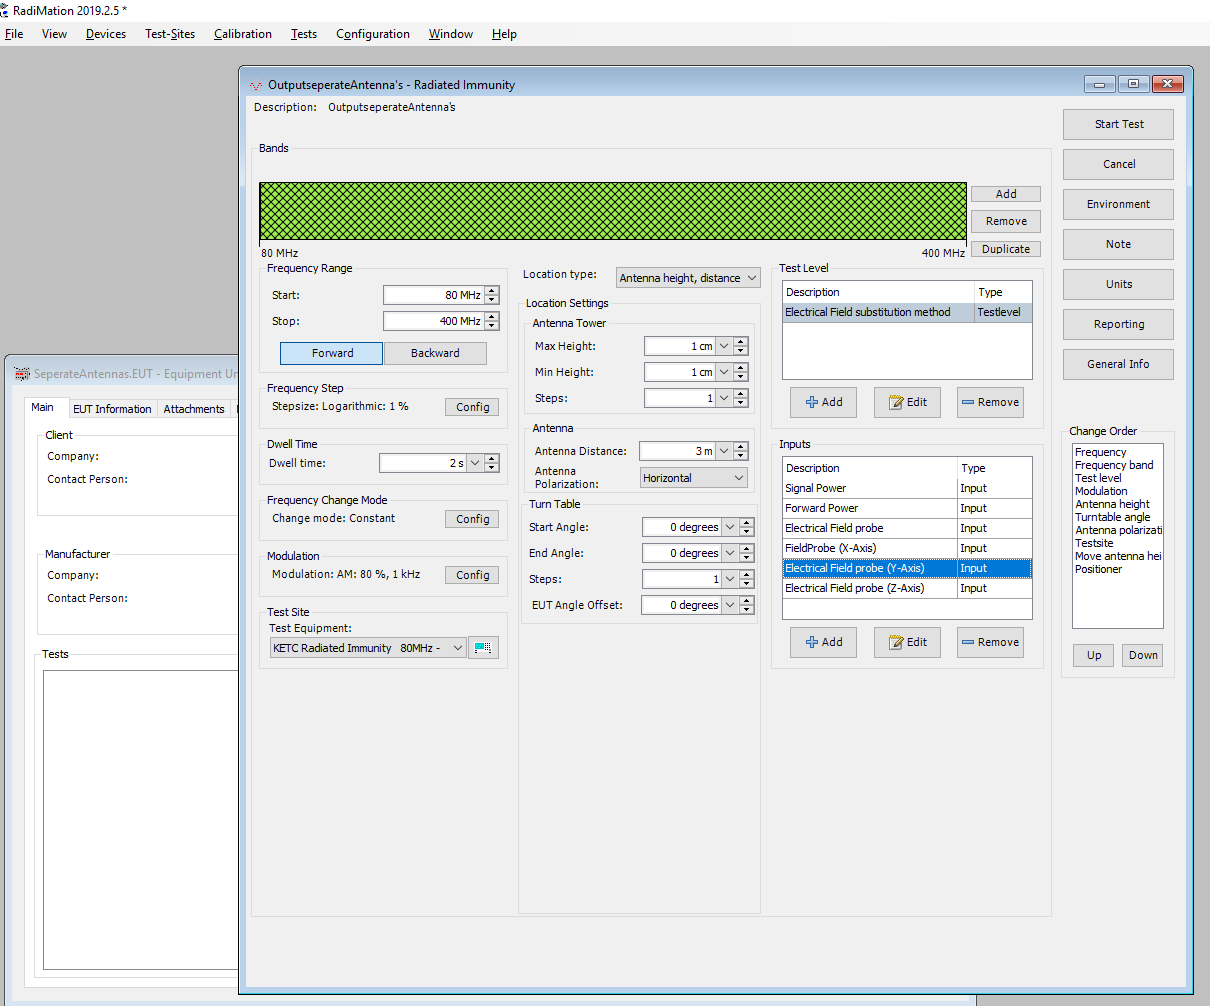
The probes can be used by adding them to "Inputs"
Make sure that you add a new input for every antenna. You can also select all probes in one input but then you will see the average.
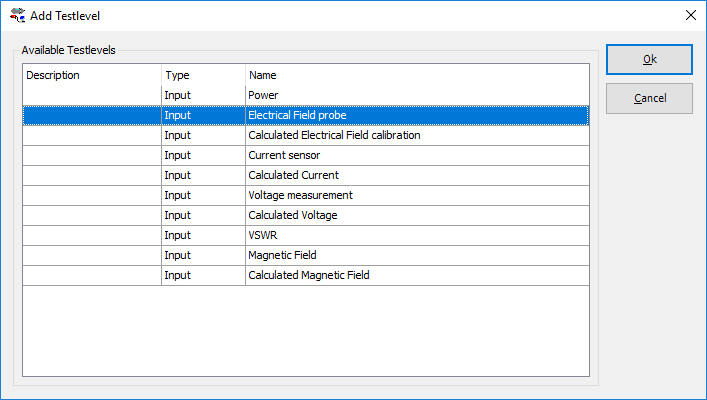
When you click "add" the following screen will appear:
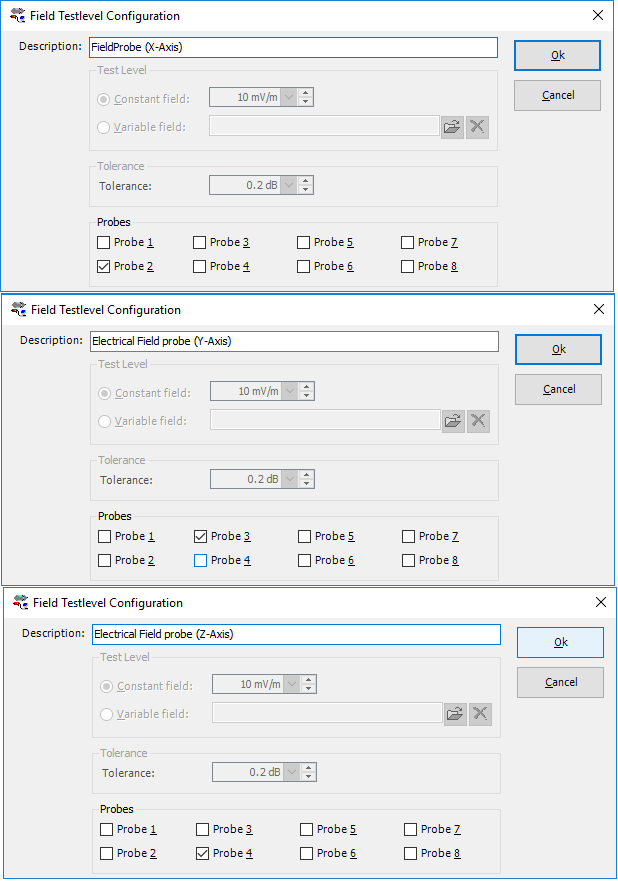
Select Field probes. The screen below will appear. Make sure that you add three new inputs and set them according to the settings shown below. Make sure that you select the right probe number for the axis.
Now the fielfdprobes are added to the test and the input screen should display the three inputs we have just added.
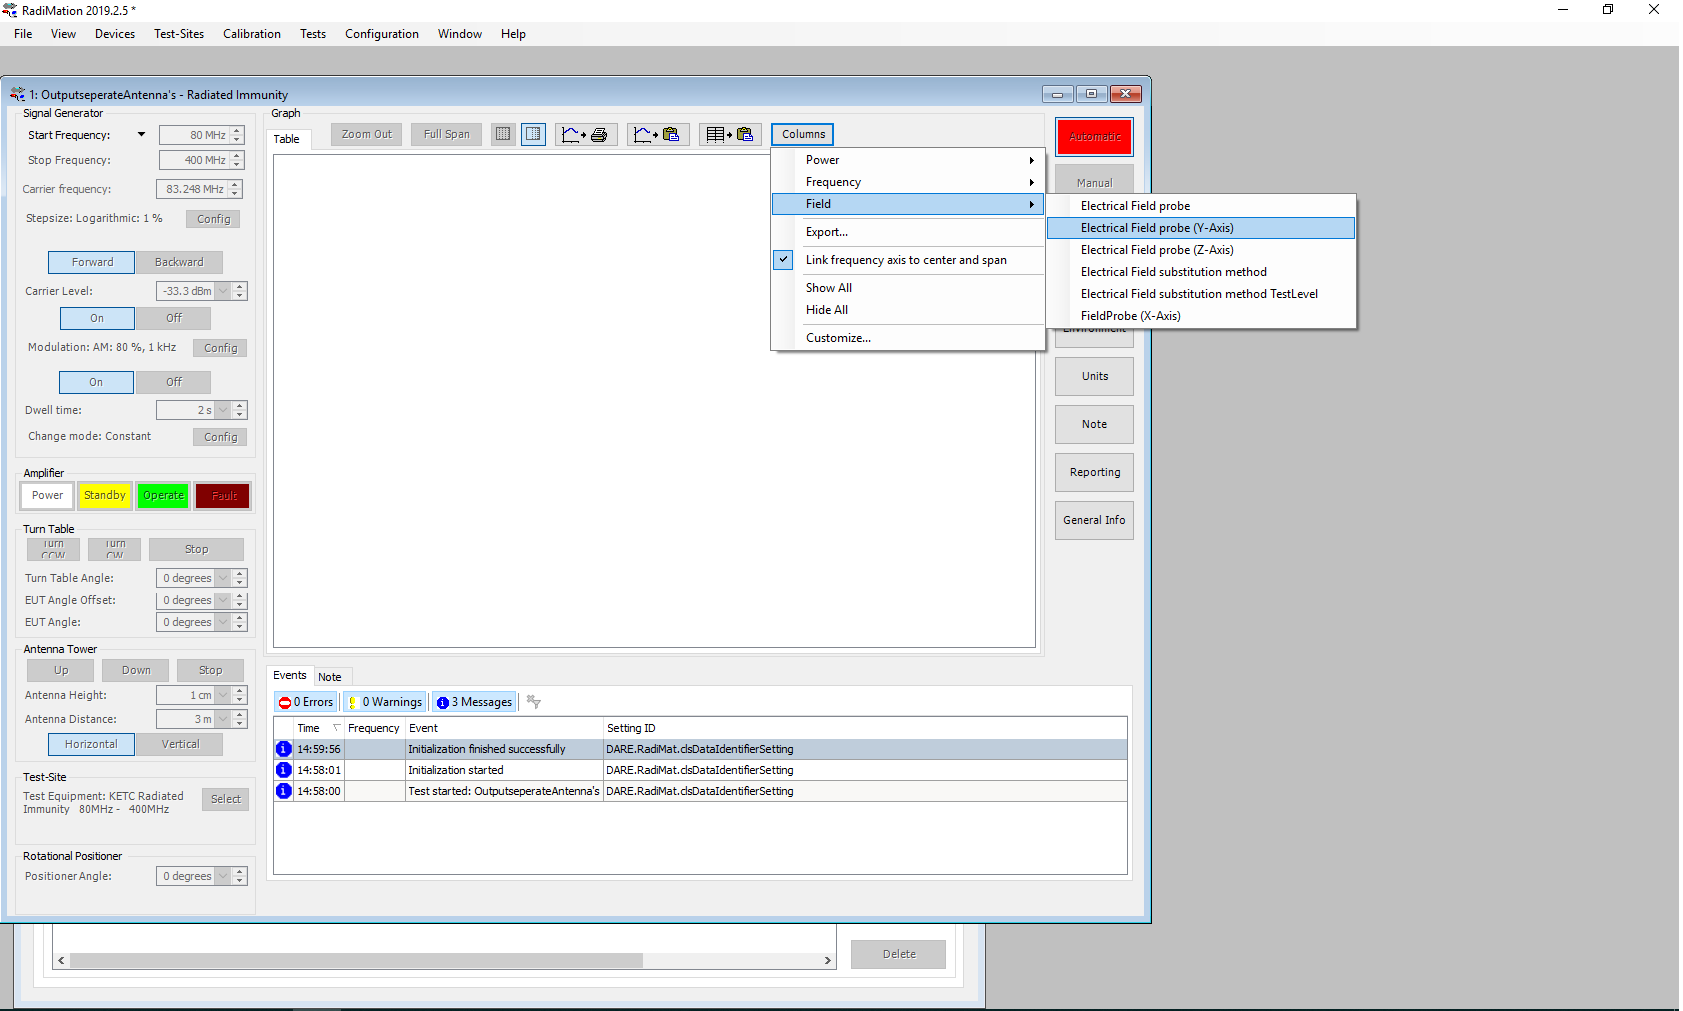
Everything is now configured and you can run the test to see if you are getting the right results. Run the test.You can add or remove the lines from the graph by clicking the graph button.Go to field and select the lines for the graphs of the x,y and z axis.
When these lines are turned on you will be able to see the seperate values in one graph
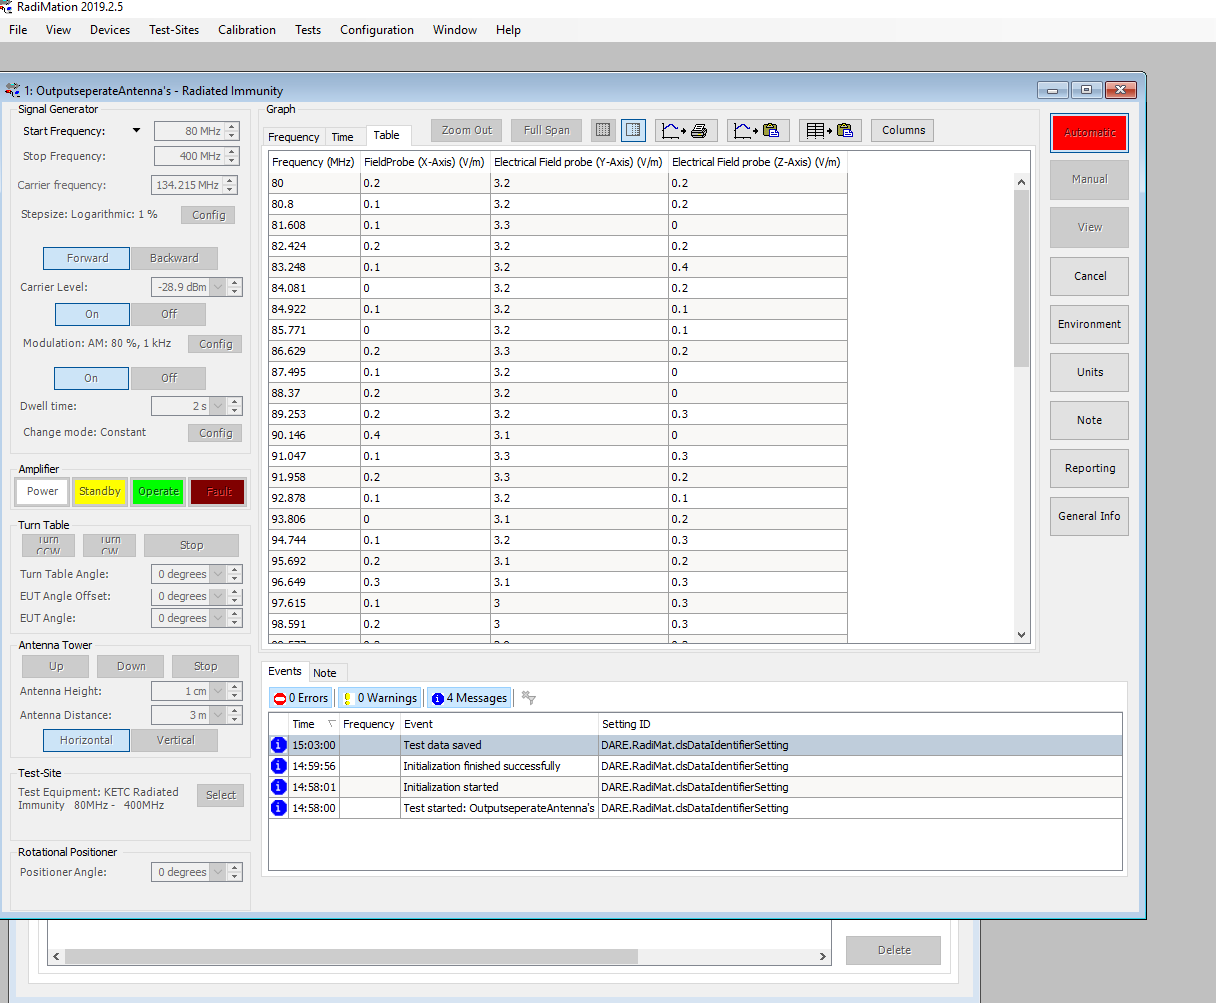
When you click columns you can also display the individual values
