This window is used to customize the settings and look of the graphs.
The look of the graph is divide in three parts:
 Close Close
|
Closes the window, and updates the graph with the modified settings
|
| Update
|
Immediately updates the graph with the modified settings, so it is possible to see the effect of the made changes. The window will not close, so it is still possible to make additional changes
|

|
| Note:
|
All changes made to the settings in this window will be stored immediately, and it is not possible to undo any performed changes
|
|
Chart
The Chart tab can be used to determine the colors and layout of the overall graph.
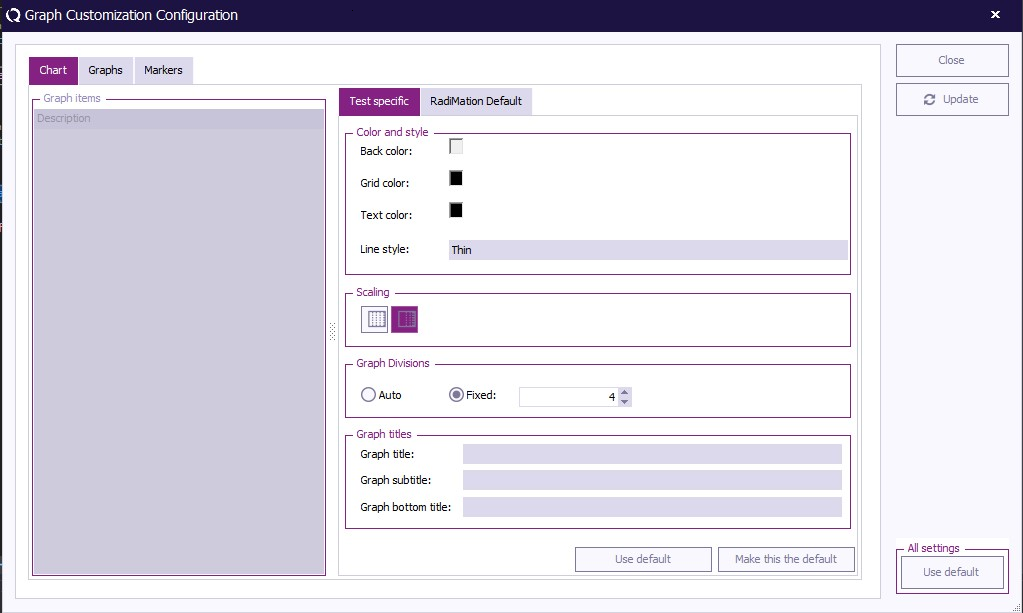
The following settings can be modified:
| Back Color
|
Shows the currently selected color for the back(ground) of the graph. The color can be changed by clicking on the color itself.
|
| Grid Color
|
Shows the currently selected color for the grid of the graph. The color can be changed by clicking on the color itself.
|
| Text Color
|
Shows the currently selected color for the text around the graph. The color can be changed by clicking on the color itself.
|
| Line Style
|
Shows the currently selected type of style that is used for the grid of the graph. Possible line styles are:
|
| Scaling
|
Determines if the initial x-axis scaling of the graph should be shown linear or logarithmic
|
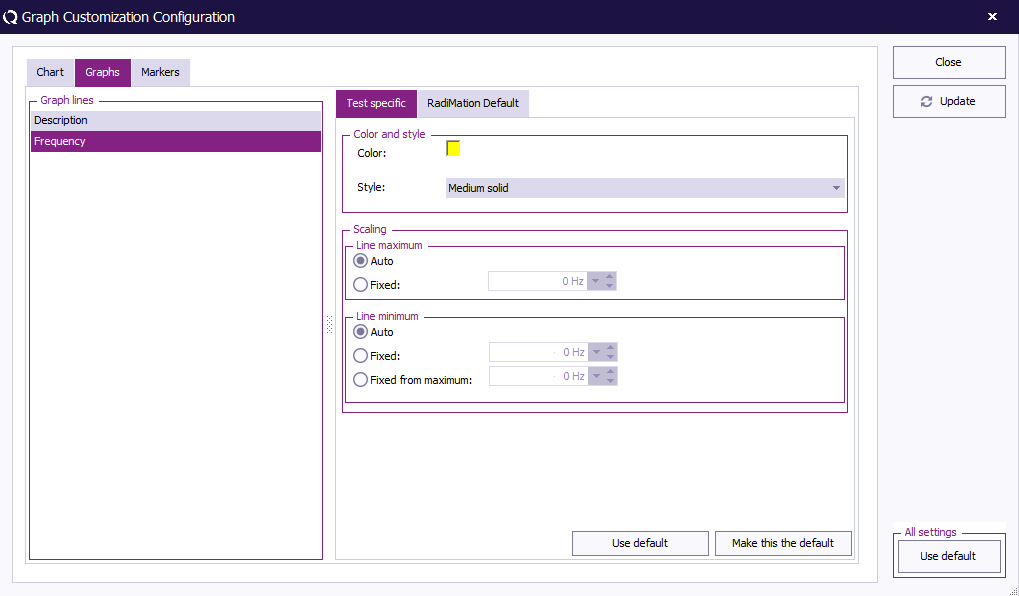
Graphs
The Graphs tab can be used to determine the colors, scaling and layout of each and every shown graph-line.
Markers

