RadiMation Application Note 100
Contents
Enhanced Status Window
Introduction
It is possible to configure RadiMation in such a way that several measurement parameters are shown in a larger font on a customized location. This functionality is called "enhanced status window", and can be configured in the RadiMation configuration dialog.
This Application Note will explain how the Enhanced Status Window settings can be configured in RadiMation®. It can be used by the EMC test engineer to provide clear status information during automatic EMC testing.
At moment of writing the Enhanced Status Window is only implemented for the Singleband tests and will therefore not (correctly) work for the Multiband tests.
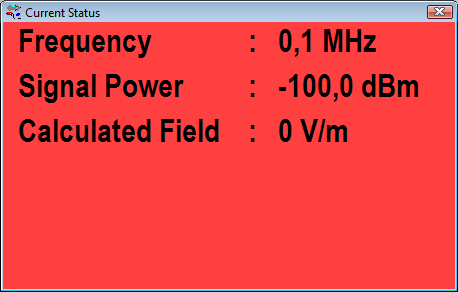
A preview of how the configured result could look like:
Configuration
To configure this feature or to completely enable or disable it, go from the RadiMation® main menu to:
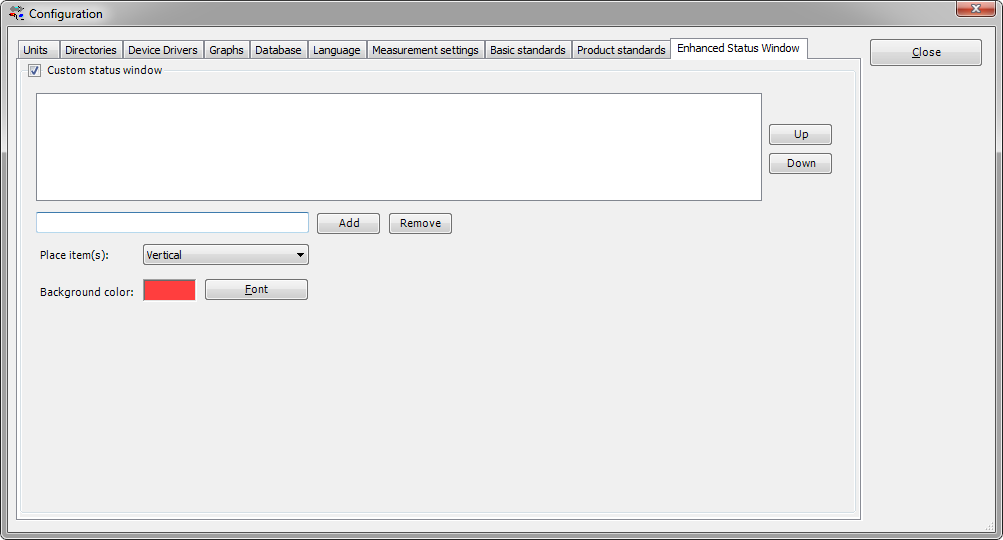
The following configuration window is shown:
With the Custom status window checkbox the Enhanced Status Window feature can be enabled or disabled.
Adding and removing parameters
The text box before the Add button can be used to specify the name of a measurement parameter. By pressing the Add button the measurement parameter will be added to the list above it. All the measurement parameters that are included in the list will be shown during the test in a separate window.
It is possible to add multiple parameters, which are available during a test. For example, the actual used frequency during the test. To show the current frequency throughout the test, type "Frequency" in the text box and press the Add button. The item will now be added to the list. It is possible to add this item multiple times, which will result that the information is also shown multiple times.
When a parameter has to be removed, select the parameter from the list and click on the Remove button.
Modifying Vertical or Horizontal
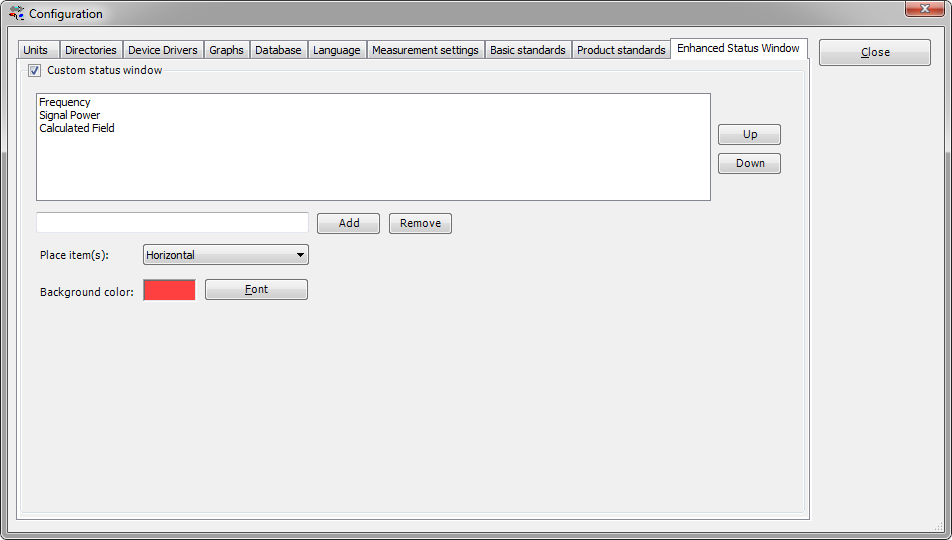
The Horizontal or Vertical setting will change the direction of the placement of the shown information. To make this even more clear how both configurations could look like when using the horizontal and vertical setting:
Using the Horizontal setting:
Using the Vertical setting:
Modifying background and font
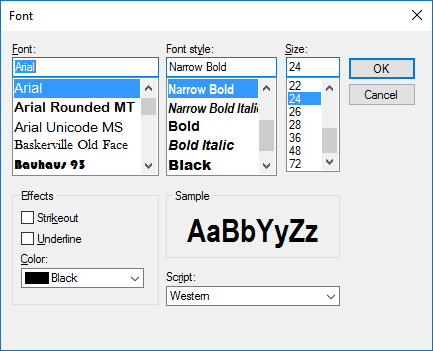
The Font button can be used to specify the font, the color and the size of the text in which the measurement parameters will be shown.
The colored box behind the Background color will be the background color of the window in which the measurement parameters will be shown.
List of measurement parameters
The following 'generic measurement parameters' are possible:
- Frequency
- Signal Power
- Forward Power
- Reflected Power
- Modulation
- Average Field
- Calculated Field
- Voltage
- Calculated Voltage
- Current
- Calculated Current
- Measured Magnetic Field
- Generated Magnetic Field
- Out Power
- Harmonic Frequency
- Received Power At Antenna
- Desired Antenna Height
- Progress Antenna Height
- Power Offset Due To Conservation
The following measurement parameters related to the 'AD-Converter' are possible:
- AD Channel 1
- AD Channel 2
- AD Channel 3
- AD Channel 4
- AD Channel 5
- AD Channel 6
- AD Channel 7
- AD Channel 8
The following measurement parameters related to the 'Field strength sensor' are possible:
- Field Sensor 1
- Field Sensor 2
- Field Sensor 3
- Field Sensor 4
- Field Sensor 5
- Field Sensor 6
- Field Sensor 7
- Field Sensor 8
Example of settings
When we have added the parameters for the 'Frequency', 'Signal Power' and 'Calculated Field' the result will look the following screenshot:
Example during test
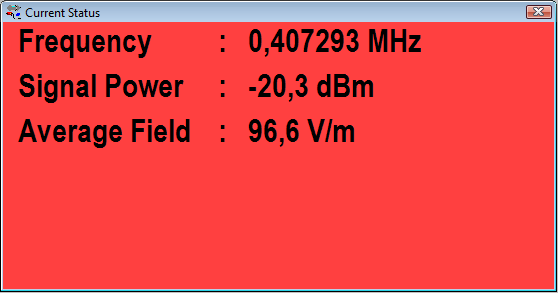
When we have removed the 'Calculated Field' and added the 'Average Field' together with the the 'Frequency' and 'Signal Power' the result of the window during the test will look the following screenshot:

