Chapter 12
Calibration[edit]
During an (immunity) calibration, RadiMation® stores all settings and used equipment during the calibration in the final calibration (CAL) file. All these important settings (like start frequency, stop frequency, probe response time, frequency step size, calibration type (FWD, transmitted or signal generator level, etc.) are recorded.
Furthermore, the following graphs are stored:
- The achieved field strength (or current or voltage) during calibration.
- The signal generator level, necessary to achieve this field strength (or current or voltage level)
- The forward power, necessary to achieve this field strength (or current or voltage level)
- The transmitted power, necessary to achieve this field strength (or current or voltage level)
| Note: | When a signal level calibration is made, the forward and reflected power graphs are not stored.
When a forward power calibration is made, the signal and forward power graph will be stored. When a net power calibration is made, the signal, forward and reflected power graph will be stored. |
All this information can later be viewed, reported, processed and printed by the end-user.
To view the results of a calibration, the calibration data can be opened from the menu:
-
 File
File
-
 Open
Open
-
 Calibration
-
-
-
Then the calibration data window is shown, and the configuration of the calibration, as well as the used equipment and the calibration data is displayed.
Frequency interpolation[edit]
RadiMation® allows you to use a frequency step size during a test, that is different than the frequency step size during the calibration. To have optimal results, RadiMation® will use a linear interpolation between the frequency point which is just below the desired test frequency (Failed to parse (SVG (MathML can be enabled via browser plugin): Invalid response ("Math extension cannot connect to Restbase.") from server "https://wikimedia.org/api/rest_v1/":): {\displaystyle f_{test - 1}} ) and the frequency point which is directly above the test frequency (Failed to parse (SVG (MathML can be enabled via browser plugin): Invalid response ("Math extension cannot connect to Restbase.") from server "https://wikimedia.org/api/rest_v1/":): {\displaystyle f_{test + 1}} ), to correctly calculate the needed power values at the desired test frequency. For the most accurate results it is however advised to perform the calibration in the same frequency range and with the same frequency steps, as will be used during the substitution test. RadiMation® will not (and cannot) allow that a test is performed on frequencies outside the calibrated frequency range.
Failed to parse (SVG (MathML can be enabled via browser plugin): Invalid response ("Math extension cannot connect to Restbase.") from server "https://wikimedia.org/api/rest_v1/":): {\displaystyle P_{test}(f_{test})[W]=P_{calibrated}(f_{test - 1})[W] + \frac{(f_{test} - f_{test - 1})\ (P_{calibrated}(f_{test + 1})[W] - P_{calibrated}(f_{test - 1})[W])} {(f_{test + 1} - f_{test - 1})}}
Formula 12-1: Frequency interpolation
Frequency interpolation can be used in combination with Amplitude extrapolation.
Amplitude extrapolation[edit]
RadiMation® allows you to run an immunity substitution test at a different test level than was used during the calibration. To facilitate this, RadiMation® will use a linear extrapolation from the calibration level to the desired level.
If, for example, at a certain frequency point 100 Watt (+50 dBm) is needed to generate an electrical field of 10 V/m (which is determined during calibration), it is possible to use this calibration file to run a substitution test at 3 V/m. RadiMation® will recalculate the needed power level to: 50 dBm - 20 log (10/3) = 40 dBm (10 Watt). Of course, amplitude extrapolation will reduce the accuracy of the test level and should therefore only be used during pre-compliance tests. For the most accurate results it is therefore advised to perform the calibration on the same test level, as will be used during the test.
Failed to parse (SVG (MathML can be enabled via browser plugin): Invalid response ("Math extension cannot connect to Restbase.") from server "https://wikimedia.org/api/rest_v1/":): {\displaystyle P_{test}(f)[dBm]=P_{calibrated}(f)[dBm] - 20 * ^{10}log{(\frac{E_{calibrated}(f)[V/m]}{E_{test}(f)[V/m]})}}
Formula 12-2: Electrical field strength extrapolation
Ampitude extrapolation can be used in combination with Frequency interpolation.
| Warning: | The amplitude extrapolation will only be correct if the amplifier works in its linear region, and was not saturated during the calibration. |
Calibration methods[edit]
RadiMation® supports three different ways of power calibration. During the configuration of the calibration, the desired method should be selected. During a test, when a calibration file is selected, RadiMation® will automatically select the method that was used during calibration.
Signal generator level calibration[edit]
When a signal generator level calibration is used, only the signal generator level is recorded during the calibration. During a test, the signal power that was recorded during a calibration will be re-established. This method does not take amplifier instability or fluctuation into account. During this calibration method no forward and reflected powermeters are required. This method is less accurate than the Forward power and Net power calibrations and therefore is not recommended for full compliance tests. Because no powermeters are used, this method is the fastest method to perform a test.
Forward power calibration[edit]
During a Forward power calibration, the forward power to the transmitting antenna is recorded. During a test, the Forward power to the antenna is kept the same as during the calibration. When this method is used, amplifier drift will have no influence on the test, because the same output power out out of the amplifier is re-established as was present during the calibration.
Net power calibration[edit]
During a Net power calibration, the Forward and Reflected power to the antenna are recorded. The difference between the Forward power and Reflected power is the Transmitted power. When net power is calibrated, then during the test, the transmitted power by the antenna is kept the same as during calibration. This method has the advantage, that the transmitted power is adjusted to be the same as during the calibration, also when a large metallic EUT is placed in front of the antenna. In that situation some RF energy can be reflected back into the antenna, resulting in a worse VSWR. If in this situation a forward power calibration or a signal generator level calibration was used, this effect is not compensated for. When net power is calibrated, the by the antenna transmitted power is kept the same as during calibration. When a net power calibration is made, this calibration file can also be used to perform a signal generator substitution test or a forward power substitution test. During a forward power calibration, the signal generator level, forward power level and the field strength during calibration are recorded.
Radiated Immunity calibration[edit]
Calibration of the radiated immunity test set-up is necessary when tests in accordance to the substitution method are performed. During a calibration, the empty anechoic chamber is calibrated. During this calibration the power to the transmitting antenna is recorded, which is necessary to achieve the desired field strength in the anechoic chamber. During the substitution test, the EUT is placed inside the anechoic chamber, and the same power is applied to the transmitting antenna. With the same power applied to the transmitting antenna, it is assumed that the the EUT is located in an electrical field that is the approximately the same as during the calibration.
Some standards describe two different methods for the actual way of levelling to a required test-level. These methods are often called the: 'Constant field strength calibration method', and the 'Constant power calibration method'. During the one-point calibrations, RadiMation® will always use the 'constant field strength calibration method' that is described by the standards. This method has several advantages:
- Some fieldsensors have problems with their accuracy at the overlapping of their measurements ranges. To avoid these problems it is better to always level to the same field strength level, which will result in the usage of the same measurement range of the field sensor.
- With the constant field strength calibration method, it is more obvious if the required field strength level can be achieved. If the 'constant power calibration method' is used, there may be a big dip or peak in the calibration. This can result in interpolation errors. For example, a constant power calibration at 50 dBm can generate a field of 100 V/m at 100 MHz, and in the same calibration it is possible that a field of 80 V/m is generated at 800 MHz, due to the amplifier/powermeters/cables and couplers characteristics. If with these calibration results, a substitution is performed for a fixed field of 110 V/m, the error that is made as a result of the extrapolation from 100 V/m will be much smaller then from 80 V/m.
- The linearity error from the field sensor is much larger than the linearity error of the powermeter. When a 'constant field calibration method' is used, the error caused by the linearity of the fieldsensor is reduced to a minimum because the field sensor is always levelled to the same measurement value. The powermeter will perform measurements over a larger amplitude range, but the dynamic range of all powermeters is large enough to have a minimal linearity error. So when the calibration is levelling on the field sensor, the linearity error of the calibration is minimal.
One-point calibration[edit]
During a one-point calibration, RadiMation® for each frequency point increases the power to the antenna, until the desired field strength is reached. Then, depending on the type of calibration method, RadiMation® records the Signal generator level, forward power and/or the transmitted power in the calibration file.
To start a one-point calibration, close all EUT windows. And select the one-point calibration from the menu:
-
 Calibration
-
 Radiated Immunity
-
 1 Point Calibration
-
-
-
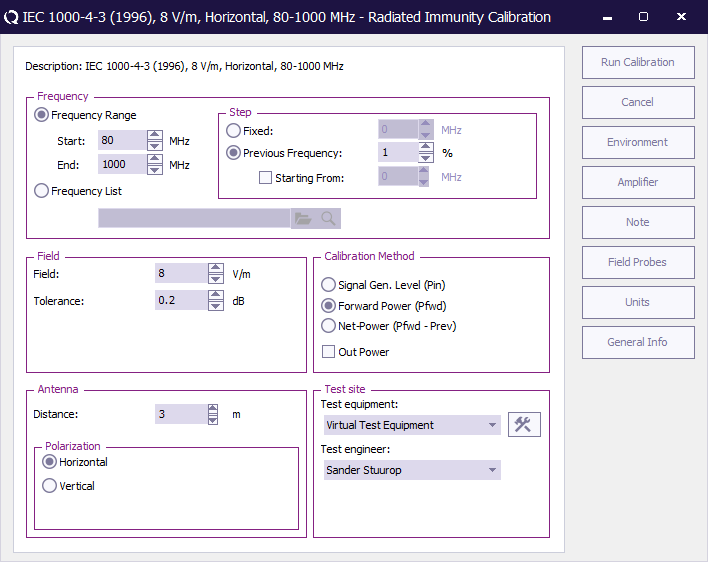
The Radiated Immunity calibration configuration window will appear, which allows modification of the settings for the calibration.
| The name of the selected TSF file |
| Sets the frequency specification to a frequency range. |
| Sets start frequency. |
| Sets end frequency. |
| Sets a fixed step size from start to end frequency. |
| Sets a logarithmic step size from start to stop frequency |
| Sets the start frequency for a logarithmic step from which the actual measurement frequencies will be calculated. The starting from frequency should be lower than the actual start frequency. The test will start at the first calculated frequency that is equal to or higher than the specified start frequency. |
| With frequency list the operator can select a frequency list file by browsing to the file location. The frequencies inside the frequency list file will be measured. |
| The field strength that should be calibrated |
| The allowed (positive) tolerance of the calibrated field strength. |
| If signal power, forward power or net-power should be logged in the resulting calibration file. |
| If the output power (from a triplate) should also be measured and stored in the calibration file. |
| The distance between the antenna and the calibration plane. |
| The polarization of the transmitting antenna. |
| In the test site window the test engineer can select which equipment list will be used during this test |
| In the test engineer window, the test engineer can select its own name. The test engineer name will be stored by the test results |
| Starts the calibration. |
| Cancel the configured calibration. |
| Display the environment window. |
| Shows the amplifier configuration dialog where limitations of the amplifiers can be selected. |
| Display the note window |
| Select one or more of the field probe(s) that should be used during the calibration. |
| Display the Units configuration window. |
The one-point calibration is also able to perform a calibration of a triplate setup. The triplate calibration is required, to perform the triplate test. With the triplate calibration it is also possible to determine the impedance of the triplate, which is needed to calculate the field. The difference between an anechoic chamber calibration and a triplate calibration is the out power. To perform a triplate calibration the Net-power calibration method as well as the out-power method needs to be selected.
To define the fieldprobe position height during a triplate calibration, use the antenna distance. The selection of a polarization does not influence the triplate calibration, and it will thus be ignored.
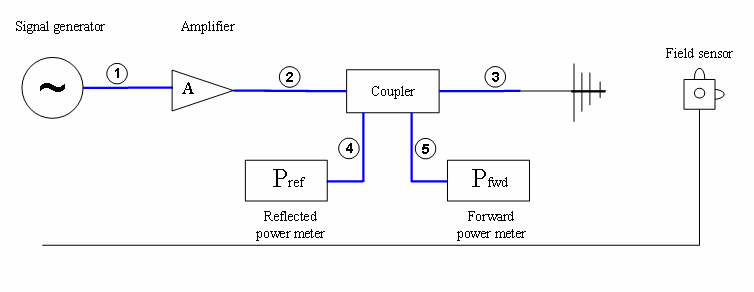
| # | Device name | Tab in RadiMation®configuration window |
|---|---|---|
| Signal Generator | Devices 1 | |
| Amplifier | Devices 1 | |
| Coupler | Devices 1 | |
| Forward Power meter | Devices 1 | |
| Reflected Power meter | Devices 1 | |
| Antenna | Devices 1 | |
| Field sensor | Field probes | |
| Cables | ||
| 1 | cable SG -> coupler | Cables |
| 2 | cable amplifier -> coupler | Cables |
| 3 | cable coupler -> antenna | Cables |
| 4 | cable coupler -> fwd power meter | Cables |
| 5 | cable coupler -> refl power meter | Cables |
| Note: | Usage of cable correction factors is not mandatory. However, using correction factors will increase measurement accuracy during immunity measurements.
When in doubt contact your reseller. |
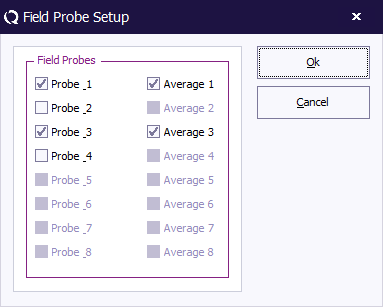
In the testsite up to 8 field probes can be selected, the calibration will only use those field probes from the testsite that are actually selected in the Field probe setup configuration dialog.
| If the probe 1 from the testsite should be measured during the calibration. |
| If the probe 2 from the testsite should be measured during the calibration. |
| If the probe 3 from the testsite should be measured during the calibration. |
| If the probe 4 from the testsite should be measured during the calibration. |
| If the probe 5 from the testsite should be measured during the calibration. |
| If the probe 6 from the testsite should be measured during the calibration. |
| If the probe 7 from the testsite should be measured during the calibration. |
| If the probe 8 from the testsite should be measured during the calibration. |
| If the measured field of probe 1 should be included in the calculation of the average field. |
| If the measured field of probe 2 should be included in the calculation of the average field. |
| If the measured field of probe 3 should be included in the calculation of the average field. |
| If the measured field of probe 4 should be included in the calculation of the average field. |
| If the measured field of probe 5 should be included in the calculation of the average field. |
| If the measured field of probe 6 should be included in the calculation of the average field. |
| If the measured field of probe 7 should be included in the calculation of the average field. |
| If the measured field of probe 8 should be included in the calculation of the average field. |
The one-point calibration will measure all the field probes that are selected to be included in the calculation of the average field. The calibration will then modify the level power and the electrical field in such a way that the average field will be regulated to the requested calibration field. It thus is required to have at least 1 probe selected to be included in the average field.
Multiband calibration[edit]
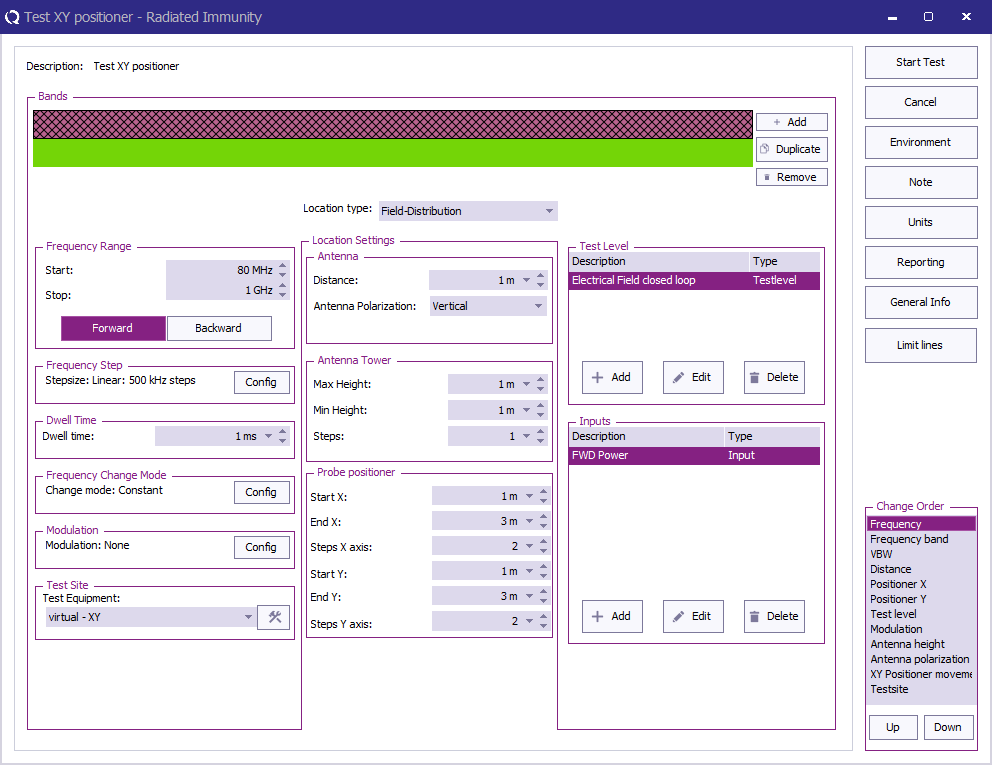
In multiband testing the calibration of multiple points can be further automated. With multiband testing, users can control the field probe positioner to measure the field strength at multiple points and regulate the electrical field during a radiated immunity multiband test.
- Start a multiband immunity test.
-
 Tests
Tests
-
 Radiated Immunity
-
 Multiband
-
-
-
- In the test configuration window, select the "Field Distribution" location type for the measurements.
- Specify the measurement settings in the radiated immunity multiband test settings.
- Define the start and end positions, along with the number of steps, for both the X-orientation and Y-orientation of the probe positioner.
- Configure any additional settings required for the test.
- Make sure that a field probe positioner driver is selected in the positioner slot of the selected test-site
- Start the test, and the probe positioner will automatically move through the specified positions, visiting all points in the X and Y orientations.
- The configured test will be performed at each location, allowing for field strength measurement and regulation.
Uniform Field Area calculation[edit]
The EN 61000-4-3 (and other standards) state that the anechoic chamber must have a homogeneous electrical field distribution in a 1.5 m x 1.5 m square area, 80 cm. above the ground.
The electrical field is defined to be homogeneous if, at 12 of 16 points in the 1.5 m x 1.5 m square the field strength lies between the desired value and the desired value plus 6 dB.
If, for example, the field homogeneity check is made at a field strength of 10 V/m, 12 of the 16 calibration points must lie between 10 V/m and 20 V/m.
Also based on this information, a power curve can be calculated, which can best be used during a substitution test, to achieve a homogeneous electrical field.
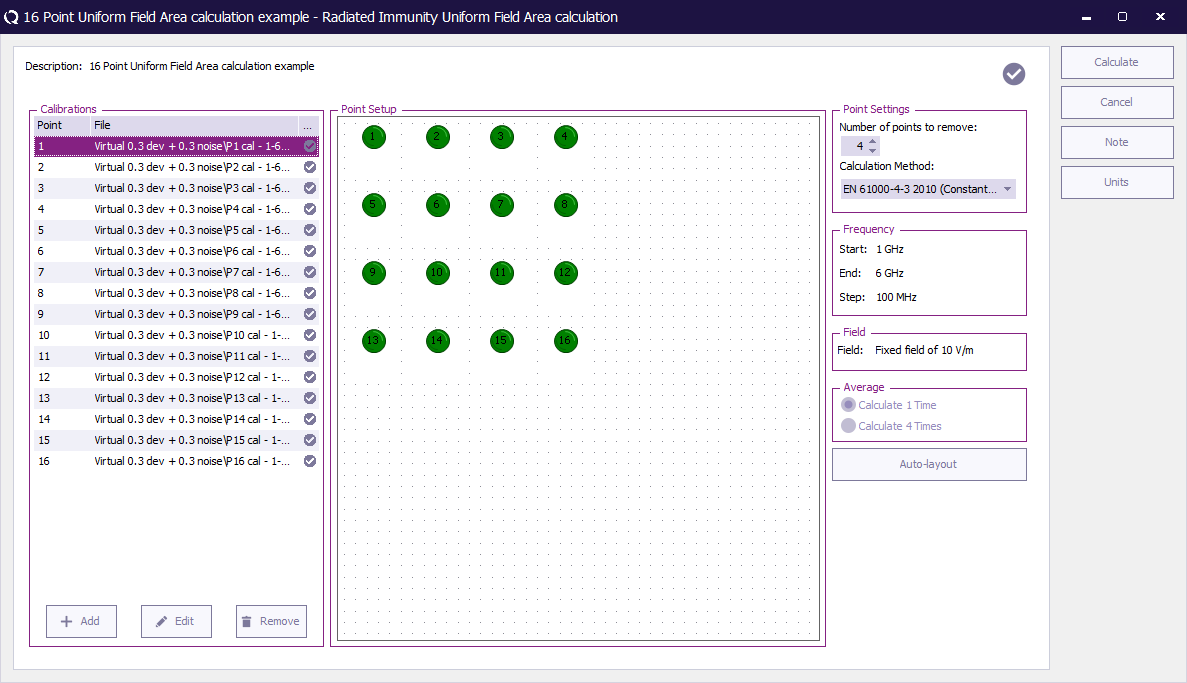
RadiMation® is able to verify and calculate the homogeneous field distribution in the 'Uniform Field Area calculation'. The input for this calculation are sixteen '1 point calibrations'. All these 16 single point calibrations, should be performed first, after which the 16 point field homogeneity verification software can be used to verify the field homogeneity in the anechoic chamber.
The Uniform Field Area calculation not only allows the calculation of this specific configuration, but it is more flexible. It is not necessary to have exactly 16 calibration points. The calculation can also be performed with less then 16 calibration points. The calculation is also able to perform calculations on calibrations that are performed on a triplate.
The Uniform Field Area calculation is started by selecting from the menu:
-
 Calibration
-
 System Calibration
-
 Radiated immunity
-
 Uniform Field Area calculation
-
-
-
-
In the Uniform Field Area calculation, after a preconfigured Uniform Field Area calculation TSF file is selected, the configuration window of the calculation is shown.
The RadiMation® package supports different ways to calculate the homogeneity of a field, and some other settings can also be configured.
| The name of the selected TSF file |
| The list of calibration files that should be included in the calculation. At least 2 calibration files should be selected, and more than 16 calibration files can be used. The correct calibration files can be added by pressing on the Add button. All the selected calibration files should have the same frequency range, frequency step, calibrated field strength level and antenna polarization. Any variation in these parameters between the selected calibration files, can result in inaccurate results of the calculation. The Uniform Field Area calculation therefore requires that the same frequency range, frequency step, calibrated field strength level and antenna polarization are used in the selected calibration files. If a calibration file is selected which has different settings compared to one of the other already selected calibration files, an error will be shown. |
| The layout of the points can be manually modified to correspond with the numbering that is used during the calibration of each individual point. |
| It is not required that always 4 calibration points are discarded during the calculation. The number in the Number of points to remove box, determines the number of calibration points that will be discarded during the calculation. This number should be between 0 and the number of calibration files that are selected. |
The calculation method that should be used by the Uniform Field Area calculation, to calculate the homogeneity. The following methods are supported:
|
| Shows the start frequency of the selected calibration files. |
| Shows the end frequency of the selected calibration files. |
| Shows the step frequency that is used in the selected calibration files. |
| Shows the field strength level that was used in the selected calibration files. |
| During some calculations, the average field of the remaining calibration points is calculated, to determine the calibration point that should be discarded. When the Calculate 1 Time option is selected, the average field will not be recalculated when the calibration point is discarded. With this option activated, the calculation for each frequency point, will take the average field of all the calibration points once, and will determine the four calibration points which differ the most from the calculated average field. This option can result in a different calculation, compared to the Calculate 4 Times option. |
| During some calculations, the average field of the remaining calibration points is calculated, to determine the calibration point that should be discarded. When the Calculate 4 Times option is selected, the average field will be recalculated when a calibration point is discarded. A removal of a calibration point will influence the average field of the remaining points, and this can influence the calibration point that should be discarded next. This option can result in a different calculation, compared to the Calculate 1 Time option. |
| The auto-layout function can be used to automatically layout the points in the grid. It is possible to specify the number of rows and columns, but also where the first point (number 1) should be positioned. After an auto-layout is performed, it is still possible to modify the layout of the points. |
| Closes the configuration window, and starts the calculation of the homogeneity of the anechoic chamber, based on the selected calibration files and settings. |
| Closes the configuration window, and no calculation will be performed. |
| Shows the Note window, in which a Note can be specified. |
| Shows the Units window, where the used units can be configured. |
EN 61000-4-3 1995 calculation[edit]
The EN 61000-4-3 standard contains a description of the uniform field, which specifies that at least 12 of the 16 calibration points should be within a -0 dB to +6 dB tolerance.
The Uniform Field Area calculation, first normalizes the power levels of all the frequencies in the selected calibration point calibration files, to the electrical field strength for which the Uniform Field Area is calculated. Every calibration file, has small deviations in the measured field strength on each frequency. It is for example possible that a 10.4 V/m (with a forward power of 56.3 dBm) is measured during the calibration of a 10 V/m field strength. This small deviation is normalized to exactly 10 V/m, by adjusting the forward power level to 56.0 dBm (more exact: 55,95933321 dBm). It is necessary to normalize the forward power levels because the differences (0.35 dB in this example) can have its influence in the reduction of the calibration points.
The 1995 version of the standard describes a method for the reduction of the calibration points, which states that a maximum of 4 points (from the total of 16 calibration points) should be removed that have the greatest deviation. The remaining points should be within +-3 dB. The final calibration file should use the calibration point that has the lowest field strength on each frequency as the reference.
This version standard doesn't describe how the greatest deviation should be calculated. The options Calculate 1 Time and Calculate 4 times, can be used in combination with this standard to achieve the best results.
RadiMation® performs this calculation method as it is described in the standard.
EN 61000-4-3 2002 calculation[edit]
The EN 61000-4-3 standard contains a description of the uniform field, which specifies that at least 12 of the 16 calibration points should be within a -0 dB to +6 dB tolerance. A bigger tolerance (from +6 dB to +10 dB) is allowed for a maximum of 3% of the calibration frequencies.
The Uniform Field Area calculation, first normalizes the power levels of all the frequencies in the selected calibration point calibration files, to the electrical field strength for which the Uniform Field Area is calculated. Every calibration file, has small deviations in the measured field strength on each frequency. It is for example possible that a 10.4 V/m (with a forward power of 56.3 dBm) is measured during the calibration of a 10 V/m field strength. This small deviation is normalized to exactly 10 V/m, by adjusting the forward power level to 56.0 dBm (more exact: 55,95933321 dBm). It is necessary to normalize the forward power levels because the differences (0.35 dB in this example) can have its influence in the reduction of the calibration points.
The 2002 version of the standard describes a method for the reduction of the calibration points, which states that a maximum of 4 points (from the total of 16 calibration points) should be removed that have the greatest deviation. The remaining points should be within +-3 dB. The final calibration file should use the calibration point that has the lowest field strength on each frequency as the reference.
This version standard doesn't describe how the greatest deviation should be calculated. The options Calculate 1 Time and Calculate 4 times, can be used in combination with this standard to achieve the best results.
RadiMation® performs this calculation method as it is described in the standard.
EN 61000-4-3 2002 Amendment 1 calculation[edit]
The EN 61000-4-3 standard contains a description of the uniform field, which specifies that at least 12 of the 16 calibration points should be within a -0 dB to +6 dB tolerance. A bigger tolerance (from -0 dB to +10 dB) is allowed for a maximum of 3% of the calibration frequencies.
The Uniform Field Area calculation, first normalizes the power levels of all the frequencies in the selected calibration point calibration files, to the electrical field strength for which the Uniform Field Area is calculated. Every calibration file, has small deviations in the measured field strength on each frequency. It is for example possible that a 10.4 V/m (with a forward power of 56.3 dBm) is measured during the calibration of a 10 V/m field strength. This small deviation is normalized to exactly 10 V/m, by adjusting the forward power level to 56.0 dBm (more exact: 55,95933321 dBm). It is necessary to normalize the forward power levels because the differences (0.35 dB in this example) can have its influence in the reduction of the calibration points.
The 2002 Amendment 1 version of the standard describes a method for the reduction of the calibration points, which states that the required power of all 16 calibration points should be sorted in ascending order. Then from the highest value in the sorted list, it should be checked that the 11 power values below the maximum power are within -6 dB to 0 dB of the maximum power value. If the 12 power values are not within the -6 dB to 0 dB tolerance, the next power value below the maximum should be compared with the 11 power values below it. The -6 dB to 0 dB check should be continued until at least 12 power values are found that are within 6 dB of used maximum power value. The final calibration file should use the calibration point that has the power value that was used as the maximum power value in the list of 12 power levels.
RadiMation® performs this calculation method as it is described in the standard.
The 2002 Amendment 1 version of the standard also specifies that the calibration should be performed on a field strength that is at least 1.8 times higher than the field strength that will be used during the substitution test. It is also stated that it has to be ensured that the amplifier is not used in a range in which it is saturated. The standard suggests that this can best be achieved by preventing that the amplifier is used above the 1 dB compression point of the amplifier.
EN 61000-4-3 2006 calculation[edit]
The EN 61000-4-3 standard contains a description of the uniform field, which specifies that at least 12 of the 16 calibration points should be within a -0 dB to +6 dB tolerance. A bigger tolerance (from -0 dB to +10 dB) is allowed for a maximum of 3% of the calibration frequencies.
The Uniform Field Area calculation, first normalizes the power levels of all the frequencies in the selected calibration point calibration files, to the electrical field strength for which the Uniform Field Area is calculated. Every calibration file, has small deviations in the measured field strength on each frequency. It is for example possible that a 10.4 V/m (with a forward power of 56.3 dBm) is measured during the calibration of a 10 V/m field strength. This small deviation is normalized to exactly 10 V/m, by adjusting the forward power level to 56.0 dBm (more exact: 55,95933321 dBm). It is necessary to normalize the forward power levels because the differences (0.35 dB in this example) can have its influence in the reduction of the calibration points.
The 2006 version of the standard describes a method for the reduction of the calibration points, which is exactly the same as the method that is described in the 2002, Amendment 1 version of the standard.
RadiMation® performs this calculation method as it is described in the standard. There is no difference in the calculation of the 2002, Amendment 1 and the calculation of the 2006 version. RadiMation® will perform the Uniform Field Area calculation exactly the same for both these versions.
The 2006 version of the standard also specifies that the calibration should be performed on a field strength that is at least 1.8 times higher than the field strength that will be used during the substitution test. It is also stated that it has to be ensured that the amplifier is not used in a range in which it is saturated. The standard suggests that this can best be achieved by one of the following procedures:
- Use the final calibration result file, to perform a signal generator level substitution test on a field strength level that is 1.8 times lower than the calibrated field strength. The forward power of the calibration file, and the forward power during the substution test should then be within 3.1 dB to 5.1 dB difference.
- Determine the 1 dB compression point of the amplifier, and ensure that the amplifier is not used above the determined 1 dB compression point. However due to impedance mismatches during the compression point calibration and the field strength calibration, this 1 dB compression point calibration is still no 100% guarantee that the amplifier is not used without saturation. In this case it is accepted that the 2 dB compression point of the amplifier is used as the maximum forward power level of the amplifier during the field strength calibration.
EN 61000-4-3 2008 calculation[edit]
The 2008 version of the EN 61000-4-3 standard describes a method for the reduction of the calibration points, which is exactly the same as the method that is described in the 2006 version of the standard.
EN 61000-4-3 2010 calculation[edit]
The 2010 version of the EN 61000-4-3 standard describes a method for the reduction of the calibration points, which is exactly the same as the method that is described in the 2006 version of the standard.
EN 61000-4-3 2020 calculation[edit]
The 2020 version of the EN 61000-4-3 standard describes a method for the reduction of the calibration points, which is exactly the same as the method that is described in the 2006 version of the standard.
ISO 11451-2 calculation[edit]
The ISO 11451-2 standard specifies that a calibration can be performed on a single location, on 2 different locations or on 4 different locations.
The calculated calibration file should use the average of the calibration points.
RadiMation® performs this calculation method as it is described in the standard.
SAE J1113-25 calculation[edit]
The SAE J1113-25 standard describes how Radiated Immunity measurements can be performed by using the triplate line method.
The following formulas are used to determine the impedance of the triplate
Failed to parse (SVG (MathML can be enabled via browser plugin): Invalid response ("Math extension cannot connect to Restbase.") from server "https://wikimedia.org/api/rest_v1/":): {\displaystyle Z(f)[\Omega]=h^2*\frac{({E_{avg}(f)[V/m]})^2}{P_{mid}(f)[W]}}
Formula 12-3: Impedance calculation of a triplate
Failed to parse (SVG (MathML can be enabled via browser plugin): Invalid response ("Math extension cannot connect to Restbase.") from server "https://wikimedia.org/api/rest_v1/":): {\displaystyle P_{mid}(f)[W]=\frac{P_{net}(f)[W] + P_{out}(f)[W]}{2}}
Formula 12-4: Middle power calculation of a triplate
Uniform Field Area calculation results[edit]
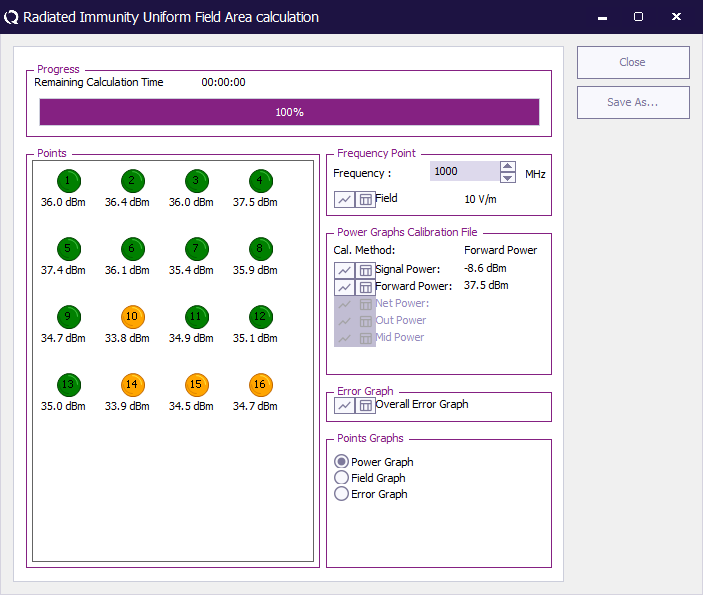
After RadiMation® has calculated the Uniform Field Area calculation, a graphical representation of the calibrations results will be displayed. The calculated information can also be saved to a calibration file, so the results of the Uniform Field Area calculation can be used during a substitution test.
The graphical representation of the calculation is shown as 16 coloured dots on the screen. Each dot represents a calibration point in the anechoic chamber. The colours of the dots have the following meaning:
- Green dot: This calibration point is one of the remaining calibration points, which are taken into account for the calibration file.
- Yellow dot: This calibration point is one of the calibration points, which are discarded by the calculation. This calibration point is one of the Number of points to remove.
- Red dot: This calibration point was not discarded by the calculation, and is thus used in the final calculation of the needed power. However, it has an error of more than 6 dB compared to the ideal calculated power. This means that this calibration point does not meet the requirements for the field homogeneity in the anechoic chamber.
| The graphical representation of the individual points |
| Selects the frequency for which the coloured dots should be shown. |
| Shows the electrical field graph for the calculated calibration file. Because the Uniform Field Area calculation always normalizes the field strength from the selected calibration files to the requested field strength, this graph will always be a straight line that is exactly the requested field strength on all the frequencies. |
| Shows the signal power graph for the calculated calibration file. |
| Shows the forward power graph for the calculated calibration file. This graph is only available if the forward or net power calibration method was selected in the original calibration files. |
| Shows the net power graph for the calculated calibration file. This graph is only available if the net power calibration method was selected in the original calibration files. |
| Shows the output power graph for the calculated calibration file. This graph is only available if the output power of a triplate was also measured in the original calibration files. |
| Shows the mid power graph for the calculated calibration file. This graph is only available if the output power of a triplate was also measured in the original calibration files. |
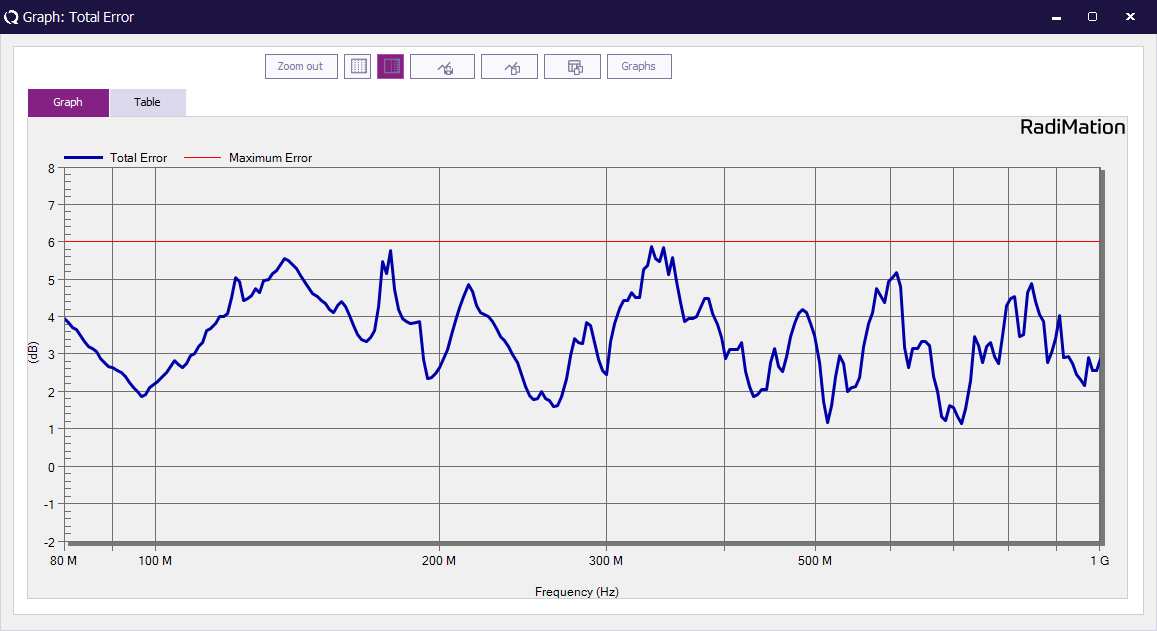
| Shows the error graph of the calibration points that are used during the calculation of the calculated calibration file. The maximum error of the remaining calibration points is shown in this graph. All the values in this graph should be below 6 dB, otherwise the homogeneity of the anechoic chamber doesn't fullfill the electrical field strength requirements. The frequencies at which the Overall error graph is more than 6 dB, are the problematic frequencies for the calibrated anechoic chamber. |
| When this option is selected, clicking one of the coloured dots will show the Power Graph for that calibration point. |
| When this option is selected, clicking one of the coloured dots will show the Field Graph for that calibration point. |
| When this option is selected, clicking one of the coloured dots will show the Error Graph for that calibration point. |
| Closes the result window, without saving the calculation results into a calibration file. |
| Shows a Save Calibration As window, where the calculation results can be saved into a calibration file. This calibration file can later be used in a substitution test, to generate an optimal uniform electrical field. The saved calibration file is another 1-point calibration file. This calibration file can be opened and reviewed again, but it will only contain the information of the calculated calibration. The saved calibration file will not contain the information of all the calibrated points, and the error graphs. The Uniform Field Area calculation does normalize the field strength level that was measured in the individual calibration points. As a result of this, the Uniform Field Area calculation is calculating and comparing all the field strength levels and their corresponding power values to the requested field strength level. This will result into a final calibration file, which has a field strength graph that is exactly the requested field strength on all the frequencies. |
For each coloured dot, also a graph can be shown, which shows the relevant information for that specific calibration point. These graphs can be shown by clicking on one of the dots. Depending on the selected Power Graph, Field Graph or Error Graph option, the corresponding graph will be shown.
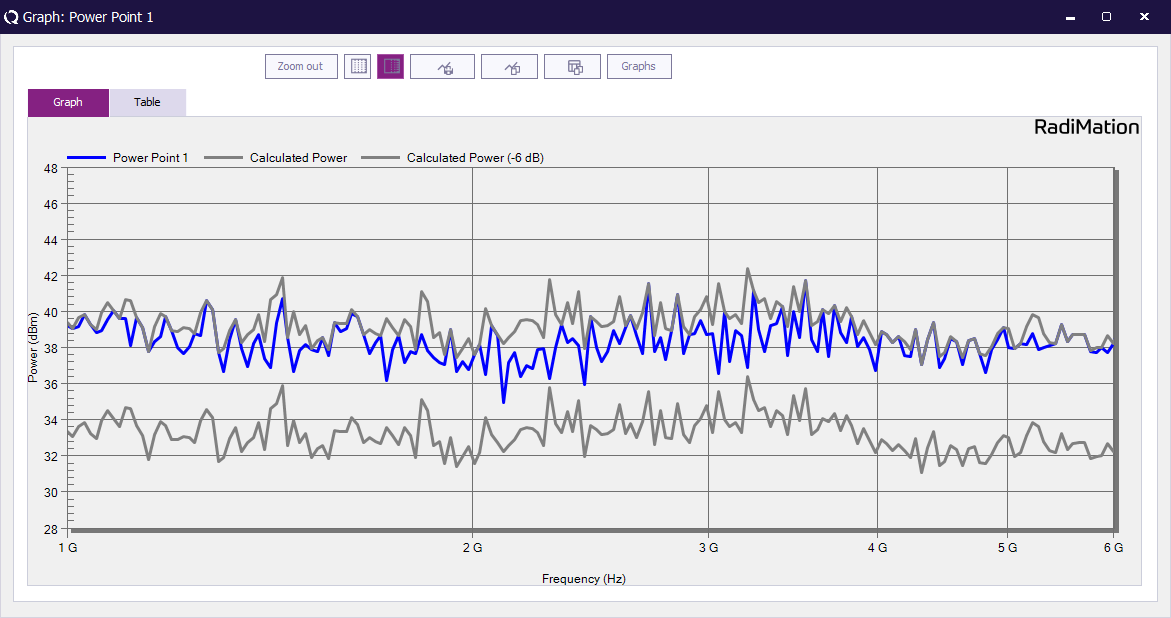
- Power Graph: Shows the power that is used to achieve the desired electrical field strength level during the calibration of the calibration point. This graph is corrected for the error and tolerance that occurred during the calibration. If the calibration is made at a test level of 10 V/m with an tolerance of 1 V/m, the Uniform Field Area calculation will more accurately determine the power that is needed to exactly achieve 10 V/m (even if the calibration is made at for example 10.4 V/m).
- Field Graph: When the final calibration file is used in a substitution test, the Field graph displays the calculated field that will be generated at the selected calibration point.
- Error Graph: The Error Graph displays the error for the selected calibration point, which is the difference between the power level on the selected calibration point, and the most ideal calibration point. On frequencies where the calibration point was discarded during the Uniform Field Area calculation, the graph will show a 0 dB error value.
In the power graph it is possible to show the following points:
- Power Point 1: The power used to get the required field for this point only (1-point calibration result).
- Calculated Power: This is the result of the UFA calculation, and this is the power used to get the required field and have 12 points within the 6 dB.
- Calculated Power (-6 dB): This field is to show the lower bound in the graph
Conducted immunity calibration[edit]
Calibration methods[edit]
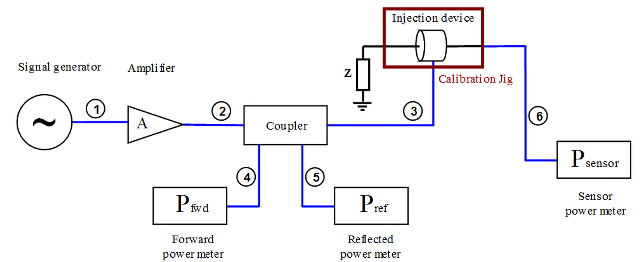
Calibration of the conducted immunity test set-up is necessary when tests in accordance with the substitution method are performed. During the calibration, the current in a reference wire is determined, and the power to the injection device is recorded.
During the test, the injecting device is connected to a cable of the EUT and the same power is injected into the cable by the usage of the injection device.
The transfer correction needs to be corresponding to the setup situation in order to obtain correct measurements, referring to Calibration Jig Transfer correction
Voltage calibration[edit]
The EN 61000-4-6 describes testing based on an EUT cable impedance of 150 Ω. To calibrate the test system, a cable with a characteristic impedance of 150 Ω is used. This reference cable is placed in the injection clamp. The left side of this cable is terminated through a 150 Ω terminator resistor. The right side of the cable is terminated with a 100 Ω resistor in series with a 50 Ω power meter. The measured power in the 50 Ω powerhead can be used to calculate the RF current in the 150 Ω reference wire.
The test level Failed to parse (SVG (MathML can be enabled via browser plugin): Invalid response ("Math extension cannot connect to Restbase.") from server "https://wikimedia.org/api/rest_v1/":): {\displaystyle U_{rms}} , as described in the EN 61000-4-6 is the output voltage of an unterminated (open circuit) generator (or amplifier). The current injected in a 150 Ω wire will thus be Failed to parse (SVG (MathML can be enabled via browser plugin): Invalid response ("Math extension cannot connect to Restbase.") from server "https://wikimedia.org/api/rest_v1/":): {\displaystyle I_{injected}=\frac{\frac{U_{rms}}{2}}{150[\Omega]}} .
If an injection clamp with a 50 Ω input impedance is used, the voltage applied to the input of the injection clamp will be Failed to parse (SVG (MathML can be enabled via browser plugin): Invalid response ("Math extension cannot connect to Restbase.") from server "https://wikimedia.org/api/rest_v1/":): {\displaystyle \frac{U_{rms}}{2}} .
By measuring the voltage across the 50 Ω powerhead, the calibration software determines the signal generator level which generates the desired current in the reference cable.
Failed to parse (SVG (MathML can be enabled via browser plugin): Invalid response ("Math extension cannot connect to Restbase.") from server "https://wikimedia.org/api/rest_v1/":): {\displaystyle U_{powerhead}[V]=U_{rms}[V] - 6[dB]-20*^{10}log\frac{50[\Omega]}{150[\Omega]}= U_{rms}[V]-15.6[dB]}
Formula 12-5: Expected powermeter reading
Example:
Test level according to EN 61000-4-6: 10 Vrms (140 dBuV) testlevel. Measured value at the powerhead: Failed to parse (SVG (MathML can be enabled via browser plugin): Invalid response ("Math extension cannot connect to Restbase.") from server "https://wikimedia.org/api/rest_v1/":): {\displaystyle U_{powerhead}[dBuV]=140[dBuV] - 15.6[dB] = 124.4[dBuV]} . In a powerhead with a 50 Ω impedance this will be: Failed to parse (SVG (MathML can be enabled via browser plugin): Invalid response ("Math extension cannot connect to Restbase.") from server "https://wikimedia.org/api/rest_v1/":): {\displaystyle P_{powerhead} = 124.4[dBuV] - 107 = 17.4[dBm]} .
The calibration is carried out with an unmodulated test signal.
| The start and stop range can be set here. Also a frequency list can be added. Correction files can be used as frequency list if the correction file contains a frequency column. |
| The step size can either be linear or logarithmic. |
| The test level can be set to a constant level. For the Variable test-level, a cor file can also be used. This can be the same file as for the Frequency List. |
| The amount and type can be selected. |
| Selection of 3 different methods. |
| Choose the ammount of samples before continuing to the next frequency. |
| For every test, a test site must be selected. |
| Device name | tab in testsite configuration | Correction | |
|---|---|---|---|
| Signal generator | Devices 1 | Output correction | |
| Amplifier | Devices 1 | Maximum input / Maximum forward / Maximum reflected | |
| Coupler | Devices 1 | Forward correction / Reflected correction | |
| Foward power meter | Devices 1 | Power Correction | |
| Reflected power meter | Devices 1 | Power Correction | |
| Injection device | Devices 2 | ||
| Calibration jig | Devices 2 | Transfer correction | |
| Sensor power meter | Devices 2 | Power Correction | |
| # | Cables | ||
| 1 | Cable SG -> amplifier | Cables | Cable loss |
| 2 | Cable amplifier -> coupler | Cables | Cable loss |
| 3 | Cable coupler -> antenna | Cables | Cable loss |
| 4 | Cable coupler -> fwd power meter | Cables | Cable loss |
| 5 | Cable coupler -> refl power meter | Cables | Cable loss |
| 6 | Cable current -> power meter | Cables | Cable loss |
Usage of correction factors is not mandatory. However, using correction factors will increase measurement accuracy during measurements. The details of the possible correction factors for each device are described in chapter 14.
Current calibration[edit]
Verification procedure:
After a calibration has been carried out, the calibrated test set-up can be checked by the following procedure. The same set-up is made as during calibration. As an extra check, a measuring current probe is placed around the 150 Ω reference wire. After the calibration has been completed, a radiated immune, substitution test is made with a test level of 10 Vrms.
The theoretical current with a test level of 10 Vrms will be: (Urms/2) / 150 = 33 mA
When a current probe with a transfer impedance of 1 Ω is used, a voltage of 33 mV should be measured (or approximately 90 dBuV).
Calibration import[edit]
RadiMation® allows to import system calibration files from other EMC immunity software packages. Regular calibration of the test setup for conducted or radiated immunity test systems is crucial to ensure accurate testing, especially in situations where any of the devices (e.g., power meter, field sensor, or signal generator) have returned from a calibration service. Keep in mind that a previous system calibration is only valid for a limited time, so periodic re-calibration is necessary to confirm the test setup's accuracy.
As a temporary measure, the calibration import function in RadiMation® can help and prevent the immediate need to perform a system re-calibration. By importing an existing and valid calibration file from another EMC immunity software package the user can create a comparable RadiMation® calibration file. This converted file can then be used for actual immunity testing in RadiMation®. This feature is particularly beneficial during the transition to RadiMation®, saving time and effort. However, it is still recommended to perform a new calibration with RadiMation® to verify the test setup's performance.
The calibration import utility in RadiMation® supports the following file formats:
- Newe-tec RSUS (*.RSU extension)
- Schaffner Compliance (*.CAL extension)
- Raditeq RadiMation (*.CAL extension)
When importing a calibration file, the measurement results and other necessary settings from the original file, along with other required settings for RadiMation®, are used to generate a new RadiMation® CAL file. During this process, you must select the appropriate test equipment and test engineer references in the calibration import utility. To ensure accurate referencing, configure all test engineers and test equipment in RadiMation® beforehand.
The newly generated RadiMation® CAL file functions as a standard CAL file and can be used for immunity substitution tests.
To access the calibration import utility, simply select it from the menu:
-
 Calibration
-
 Import...
-
-
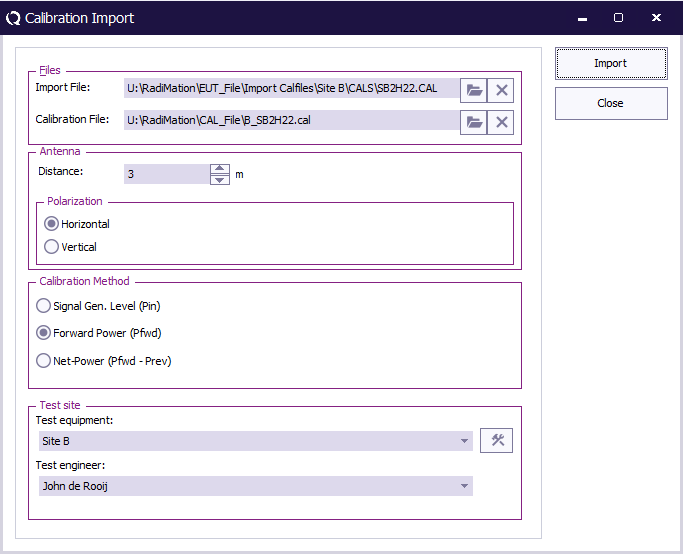
The Calibration Import dialog will be shown:
The Calibration Import dialog allows you to configure the required settings for converting calibration files from other EMC immunity software packages:
| The input file for the conversion, which is the calibration file from the other EMC immunity software package. |
| The generated calibration file after conversion, which will be the new RadiMation® CAL file. |
| The antenna distance to be set in the CAL file. (Only applicable when converting a radiated immunity calibration file) |
| The antenna polarization (Horizontal or Vertical) to be set in the CAL file. (Only applicable when converting a radiated immunity calibration file) |
| The power measurement reference method to be set in the CAL file. |
| The test equipment and used equipment to be set in the CAL file. |
| The test engineer who performed the calibrations to be set in the CAL file. |
| Performs checks to determine if the conversion can be performed, and generates the specified Calibration File. |
| Closes the dialog without generating the CAL file. |
Clicking on the Import button imports, checks, converts, and saves the calibration file specified at Import File to the RadiMation CAL file. If an error is detected during the import, an error message explaining the detected problem is shown. If the import and conversion are successful, a confirmation message is displayed, stating that the calibration file has been correctly converted. After the conversion, the dialog remains open, but it can be closed by clicking on the Close button.
The generated RadiMation calibration file also contains an events log that mentions the full path and filename of the original calibration file.
It is also possible to select a RadiMation CAL file for the Import File. This allows you to use the data from the original RadiMation CAL file to be converted into another RadiMation CAL file with modified settings such as Distance, Polarization, Calibration Method, Test Equipment, or Test Engineer.
The calibration import utility is also capable of merging multiple calibration files into a single calibration file. If the Calibration File to be generated already exists, the imported calibration file will be merged with the existing calibration file. For example, you can first import a calibration file for the 80 MHz - 1000 MHz frequency range, and then do an additional import from a calibration file for the 1000 MHz - 6000 MHz frequency range. The final generated calibration file will then contain all the data from 80 MHz up to 6000 MHz. However, for duplicated frequencies (e.g., 1000 MHz in this example), the information from the first imported calibration file will be used, and the information of the 1000 MHz frequency point from the last imported calibration file will not be included.
The correctness of the calibration file can be verified by opening the generated calibration file in RadiMation® and comparing the values of the test level, signal power, and/or forward power to the values that are present in the other EMC immunity software package. This allows for cross-validation and ensures that the imported calibration file is accurate and aligned with the values from the original software package.
Multiband calibration export[edit]
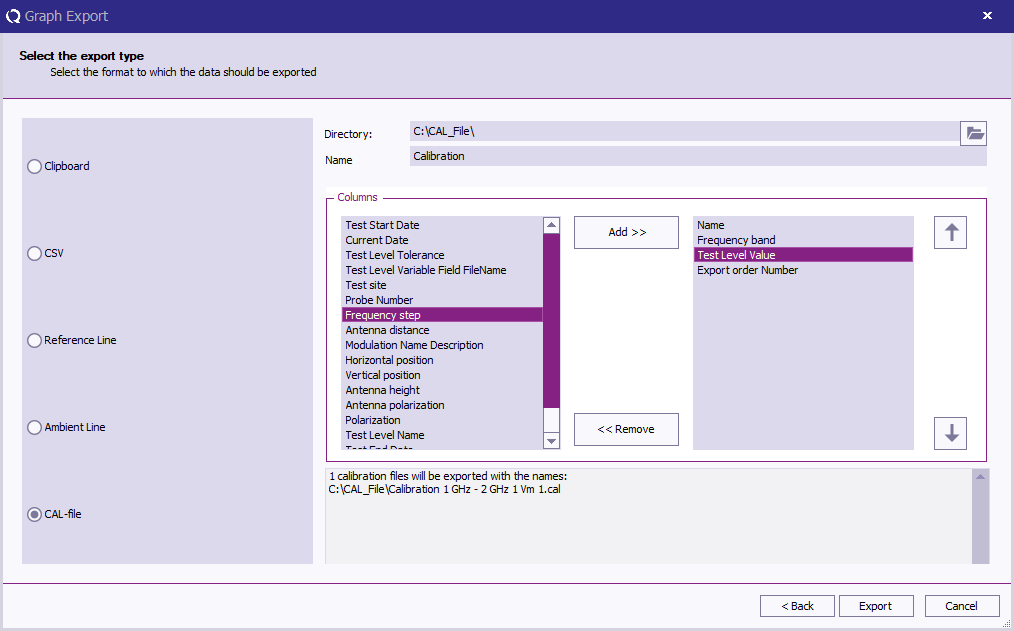
RadiMation® also provides a export feature to generate individual calibration files for all the field strength graphs obtained during multiband tests. Once an electrical field multiband test is completed, the relationship between the generated power and the achieved electrical field strength can be exported to a .CAL file.
-
 Graphs
-
 Export
-
 <graphline>
-
 CAL-File
-
-
-
-
The export configuration dialog in RadiMation® offers controls to customize the calibration file names for efficient organization.
Functionalities include:
- Selecting the directory for exporting calibration files.
- Specifying a custom identification through a text box for naming the files.
- Including report generator codes in the name to build the final calibration filename.
- Interchanging different variables between the "available" and "use" lists for flexible file naming.
- Moving variables up and down in the "use" list to determine their order in the filename.
- Building the filename using the selected directory and variables with proper spacing and unit representation.
- Ensuring unique filenames through validation checks.
- Displaying the expected amount and full path names of the to-be-exported calibration files for review.
- Storing export settings in the global RadiMation configuration directory for future use.
System Calibration[edit]
System calibrations are performed on a test setup, before the test setup can be used to perform the actual calibration on a device that should be calibrated. Some examples of supported (system) calibrations are:
- Attenuation measurements of cables, couplers or other attenuators.
- 1-16 point calibration of anechoic chamber before a radiated immunity test can be performed.
- Calibration of conducted immunity setup before a conducted immunity test can be performed.
- Open/Short/Through calibration of network analyser before S-parameter measurement can be performed.
Attenuation system calibration[edit]
During the system calibration for the attenuation the complete set up is connected but without the EUT.
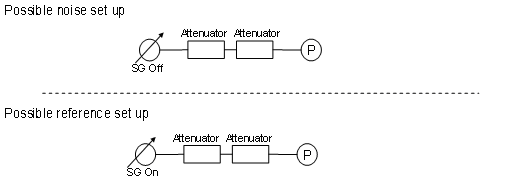
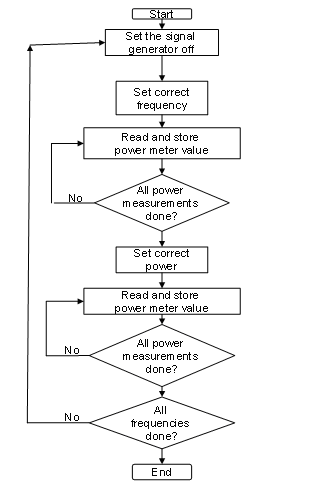
During the system calibration the signal generator is turned on and off at each frequency to determine the dynamic range at that certain frequency. The flow chart below describes the system calibration. The routine has been optimized for the least amount of power switching. The system calibration for attenuation is performed in two steps:
- The frequency response of the signal generator and power meter is determined. The measurement response is used as a correction for the actual attenuation calibration of the d.u.t. during the attenuator calibrations.
- The dynamic range of the test setup is determined. This is done by switching of the signal generator and measuring of the noise floor.
The dynamic range is the difference between the measured power when the signal generator is on and when the signal generator is off.
Failed to parse (SVG (MathML can be enabled via browser plugin): Invalid response ("Math extension cannot connect to Restbase.") from server "https://wikimedia.org/api/rest_v1/":): {\displaystyle Dynamic\ range[dB] = P_{on}[dBm] - P_{off}[dBm]}
Formula 12-6: Dynamic range
System calibration set up
Before starting a system calibration, make sure all the EUT windows are closed. The configuration window of a system calibration can be opened by selecting from the menu:
-
 Calibration
-
 System Calibration
-
 Attenuation / Gain
-
-
-
In the configuration window you can define the number of samples that should be taken. The fastest way is one sample but this will disable the calculation of the standard deviation.
Power meter setting[edit]
For every frequency the average of all the samples is taken using the formula below
Failed to parse (SVG (MathML can be enabled via browser plugin): Invalid response ("Math extension cannot connect to Restbase.") from server "https://wikimedia.org/api/rest_v1/":): {\displaystyle P_{powermeasurement}(f)[dBm]=10*^{10}log(\frac{\sum_N^{i=1}10^{\frac{P_{powermeter}(f,i)[dBm]}{10}}}{N})}
Formula 12-7: Average power calculation
As can be seen the average of the power measurement is taken over the linear value.
| Note: | The power measurement settings done in the device driver configuration screen are the settings for one sample. This is done because each power meter has a different leveling and measuring time. For the most optimal settings look at the device driver chapter for explanation and tips. |
Signal power setting[edit]
The signal generator level is set for the complete frequency range, this is desirable because it gives you full control. For example you can set the signal generator level higher when the dynamic range is insufficient, or lower when using a small amplifier.
Reviewing measurement data[edit]
During and after the test it is possible to view graphs by pressing the graph buttons.
In the graph window additional graphs for the related information can be added to the graphs. If the system calibration is configured to use multiple samples of the powermeter, the standard deviation of the following items is calculated:
- Dynamic range
- Reference attenuation
- Reference noise floor
Calculation of the standard deviation is done by using the formula:.
Failed to parse (SVG (MathML can be enabled via browser plugin): Invalid response ("Math extension cannot connect to Restbase.") from server "https://wikimedia.org/api/rest_v1/":): {\displaystyle Stddev=\sqrt{ \frac{ {\sum_{n=1}^N}{X}^2(n) - N * { (\frac{ {\sum_{n=1}^N}{X}(n) } { N})} ^2 } { N - 1} }}
Formula 12-8: Standard deviation
The standard deviation for the dynamic range is calculated using the formula:
Failed to parse (SVG (MathML can be enabled via browser plugin): Invalid response ("Math extension cannot connect to Restbase.") from server "https://wikimedia.org/api/rest_v1/":): {\displaystyle Stddev_{dynamic\ range}=\sqrt{(Stddev_{reference\ attenuation})^2 + (Stddev_{reference\ noise \ floor})^2}}
Formula 12-9: Standard deviation of the dynamic range
System Compression Calibration[edit]
The goal of the system compression calibration is to increase the accuracy of the measurement. It is possible to perform the EUT compression calibration without a system calibration but this may have a measurement error in the number of 0.3 or 0.4 dB. This error comes from the difference between the signal generator and the power meter. Also attenuator clicks in the signal generator are not corrected. In the ideal situation there is no need for a System calibration.
The general thought behind the calibration is, the signal generator nor the power meter are exactly correct for every frequency and every power level. The signal generator has attenuator switches that can cause an error and the power meter has power ranges that can cause an error. Because this is a relative measurement, the power meter is defined to be infinitely accurate. The software records the difference between the signal generator and the power meter, measured with the new “accurate” power meter.
| Note: | Setting the power meter to be infinitely accurate is only valid in a relative measurement. The error caused by the power meter and the signal generator are corrected in the signal generator. |
To open the configuration window of a system calibration select. Before starting a calibration of a system make sure all the EUT windows are closed.
-
 Calibration
-
 System Calibration
-
 Gain Compression
-
-
-
In the configuration window you can define the number of samples you want to take. The fastest way is one sample but this will leave the possibility for standard deviation calculation out.
Power meter setting[edit]
For every frequency the average of all the samples is taken using the formula below
Failed to parse (SVG (MathML can be enabled via browser plugin): Invalid response ("Math extension cannot connect to Restbase.") from server "https://wikimedia.org/api/rest_v1/":): {\displaystyle P_{powermeasurement}(f)[dBm]=10*^{10}log( \frac{ \sum_{i=1}^N 10^{ \frac{P_{powermeter}(f,i)[dBm]} {10} } } {N} )}
Formula 12-10: Average power calculation
As you can see the average is taken over the linear power value.
| Note: | The power measurement settings done in the device driver configuration screen are the settings for one sample. This is done because each power meter has a different leveling and measuring time. For the most optimal settings look at the device driver chapter for explanation and tips. |
Signal power setting[edit]
The signal generator level is set for the complete frequency range, this is desirable because it gives you full control. For example you can set the signal generator level higher when the dynamic range is insufficient, or lower when using a small amplifier.
| Note: | When inserting the calibration in the EUT compression configuration the same test levels are used. It is not possible to change the value, so select the settings with care. |
Network Analyser (S-Parameter)[edit]
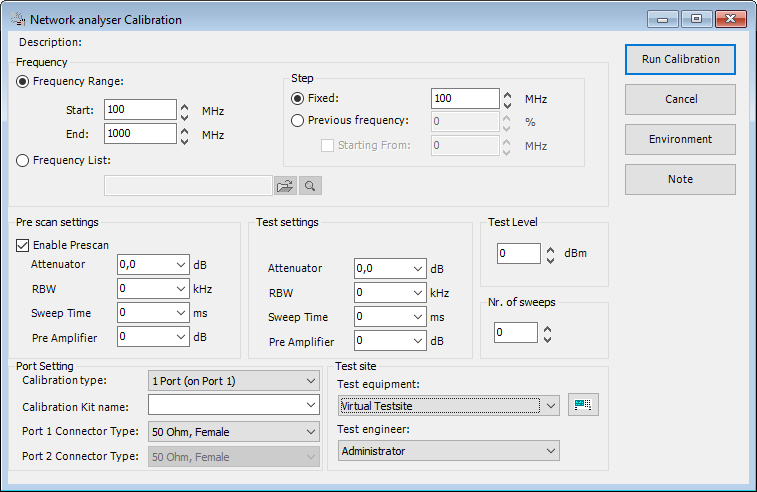
Before RadiMation® can measure S parameters it first needs a calibration file of the network analyser. Make sure all the EUT windows are closed first. To open the configuration window of the system calibration select.
-
 Calibration
-
 System Calibration
-
 Network Analyser (S-Parameter)
-
-
-
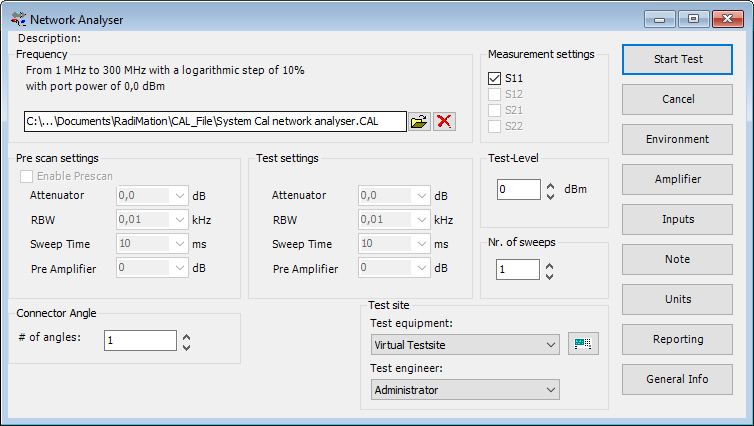
Create or choose an existing calibration.
| Sets the start frequency. |
| Sets the stop frequency. |
| With a frequency list the operator can select a frequency list file by browsing to the file location. The frequencies inside the frequency list file will be measured. |
| Sets the fixed stop in MHz to use. |
| Sets the increment in percentage to use. |
| Sets the starting frequency. |
| Sets the prescan enabled. |
| Sets attenuator value in dB. |
| Sets the RBW in kHz. |
| Sets the sweep time in ms. |
| Sets the pre amplifier in dB. |
| Sets the test level. |
| Sets the number of sweeps. |
| Sets the type of calibration, Port 1, Port 2 or Full port. |
| Sets the name of the calibration kit used. |
| Sets the connector type of port 1. |
| Sets the connector type of port 2. |
| Sets the equipment to use. |
| Sets the engineer. |
Press Run Calibration to start the process.
During the calibration process RadiMation® will ask to connect either a short, open, match or through depending on the calibration type selected.
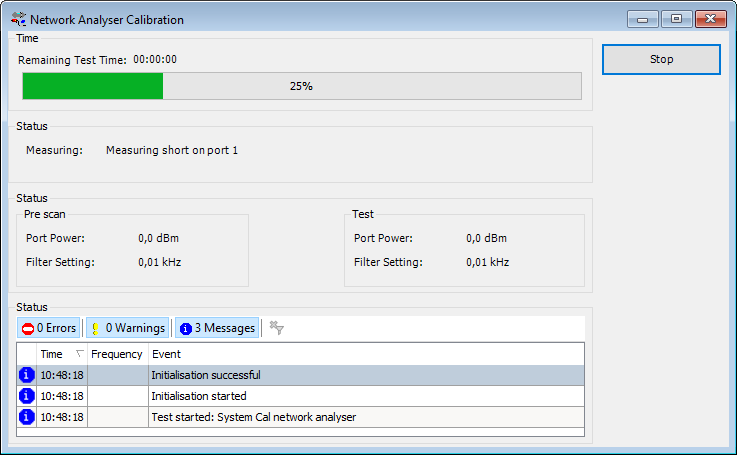
When the process is finished RadiMation® will prompt to save the Calibration file, which is needed to run the EUT S Parameter test.
EUT Calibration[edit]
EUT calibrations are performed on devices that are considered to be an EUT. For example, during an attenuation calibration, the attenuation of an attenuator, cable or coupler can be measured.
EUT Attenuation Calibration[edit]
During an attenuation calibration, the attenuation of an attenuator, cable or coupler can be measured. It is also possible to use the calibration to determine the gain of an amplifier. The attenuation will in this case have a negative value.
EUT Attenuation Calibration[edit]
Before an EUT calibration can be performed, the calibration system first needs to be calibrated using a system calibration. After calibrating the EUT there is a possibility to save the measured attenuation into a correction file.
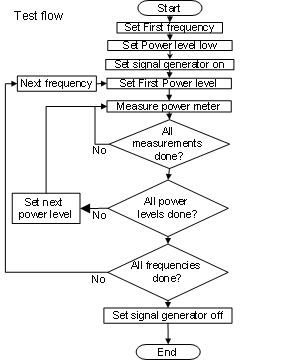
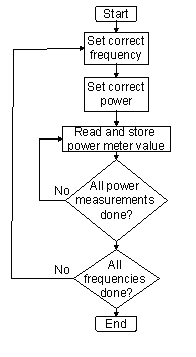
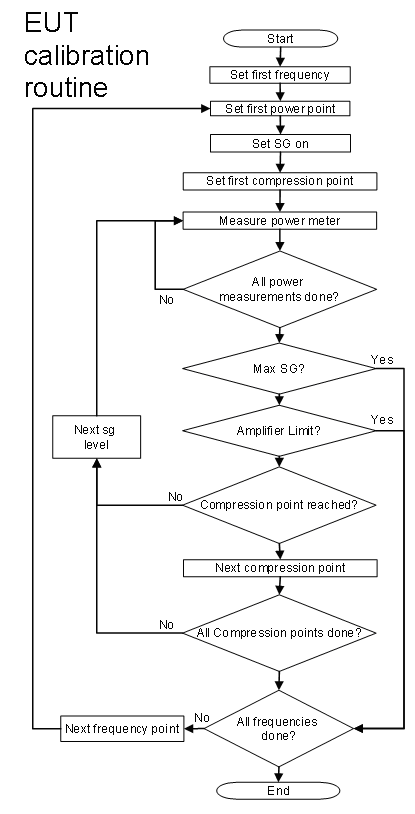
The flowchart below describes the testing procedure used for EUT calibration.
EUT calibration set up[edit]
To open the configuration of a calibration, as shown below, make sure the correct EUT window is open. Then select from the menu:
-
 Calibration
-
 EUT Calibration
-
 Attenuation / Gain
-
-
-
Select the correct calibration file and all the other settings will automatically be set.
The EUT calibration is performed with the same configuration settings as the configuration of the system calibration that was selected. This will ensure the lowest error, and the highest accuracy during the calibration:
- There is no interpolation error possible between frequency points.
- The calibration is performed at the same signal generator level preventing extra amplitude errors.
- Error budget calculation is possible
Reviewing measurement data[edit]
In the EUT calibration the standard deviation of the following items are calculated:
- Dynamic range
- EUT attenuation
For the dynamic range the standard deviation is calculated with the formula below Failed to parse (SVG (MathML can be enabled via browser plugin): Invalid response ("Math extension cannot connect to Restbase.") from server "https://wikimedia.org/api/rest_v1/":): {\displaystyle Stddev_{dynamic range}=\sqrt{(Stddev_{EUT-attenuation})^2 + (Stddev_{reference\ noise \ floor})^2}}
Formula 12-11: Standard deviation of the dynamic range
For the attenuation the standard deviation is calculated with the formula below
Failed to parse (SVG (MathML can be enabled via browser plugin): Invalid response ("Math extension cannot connect to Restbase.") from server "https://wikimedia.org/api/rest_v1/":): {\displaystyle stddev_{attenuation}=\sqrt{(stddev_{reference})^2 + (stddev_{measurement})^2}}
Formula 12-12: Standard deviation of the attenuation
In the information screen you can create a correction file for the attenuation measured. After pressing the “Create correction file” button a save dialog will appear, allowing you to select the desired path and filename for the correction file. This correction file can be attached to the calibrated device. For example, when the frequency response of a cable is measured, the correction file can be attached to the cable device driver, in the configuration menu of the cable.
EUT Compression Calibration[edit]
EUT compression calibrations are performed on amplifiers that are considered to be an EUT. The goal of this calibration is to determine the 1 dB or 2 dB compression point. The calibration also allows to calibrate any other compression point, because the required compression levels can be configured in the calibration. It is thus also possible to measure for example the 1 dB and the 3 dB compression points during a single calibration.
Before a EUT calibration can be performed, it is best to first perform the system calibration. This will decrease the overall error, which is depending on the devices you are using. The flowchart below describes the testing procedure used for EUT calibration.
EUT calibration set up[edit]
To open the configuration of the amplifier compression calibration, make sure the correct EUT window is open, and then select from the menu:
-
 Calibration
-
 EUT Calibration
-
 Gain Compression
-
-
-
The configuration can be automatically set by selecting the correct amplifier compression system calibration file.
The EUT calibration is then configured to be performed with the same configuration settings as during the system calibration, to perform the calibration with the lowest possible error.
- There is no interpolation error possible between frequency points.
- The calibration is performed at the same signal generator level preventing extra amplitude errors.
When no amplifier compression system calibration file has been selected, the settings of the test can also be set manually.
Calibration of an amplifier can result in damaging the amplifier itself! It is therefore suggested to use the following security precautions during these type of calibrations:
- Signal power amplifier protection} should be set high enough for testing. The maximum input level is default 0 dBm when no correction file is attached to the amplifier. With a correction file the maximum input can be set higher than 0 dBm.
- Forward power amplifier protection should be used when the amplifier has an output power protection. The failsafe option is setting the limitation to the maximum and decrees this with one step size of the test. For example the limitation is set on 56,5 dBm (450 Watt) and the step size is 0.3 dB, than the limitation should be set on 56,2 dBm (420 Watt). This way the changes of the amplifier turning off during testing will become significantly smaller.
- Start level of the signal generator should be set on 20 dB lower than the lowest point specified by the manufacturer.
- Stop level of the signal generator should be the maximum input of the amplifier, most of the times this level will not be reached.
| Note: | Please note that these settings are guidelines and should be treated as such. |
Reviewing measurement data[edit]
In the results overview of the amplifier compression EUT calibration the standard deviation of the following items are calculated:
- Small signal gain power
- Compression points power
| Note: | Please note that when no compression points are found, no data will be shown in compression point table. |
EUT Harmonics[edit]
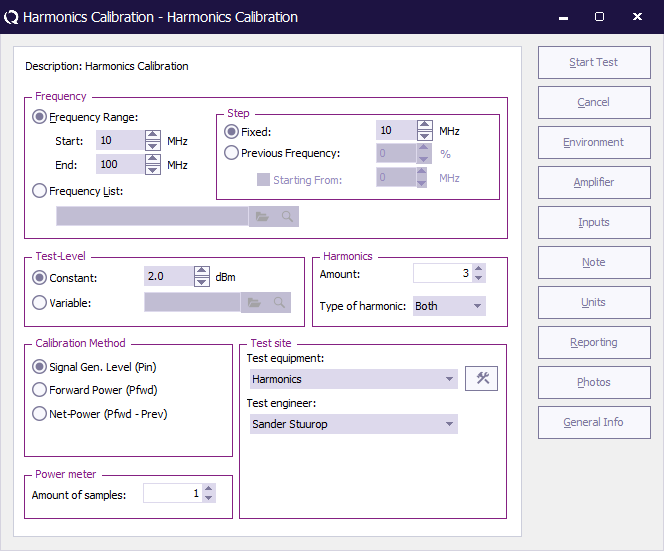
| The name of the selected TSF file. |
| Sets the frequency specification to a frequency range. |
| Sets start frequency. |
| Sets end frequency. |
| Sets a fixed step size from start to end frequency. |
| Sets a logarithmic step size from start to stop frequency |
| Sets the start frequency for a logarithmic step from which the actual measurement frequencies will be calculated. The starting from frequency should be lower than the actual start frequency. The test will start at the first calculated frequency that is equal to or higher than the specified start frequency. |
| With frequency list the operator can select a frequency list file by browsing to the file location. The frequencies inside the frequency list file will be measured. |
| The test level can be set to a constant level. |
| A .COR file can also be used. This can be the same file as for the Frequency List. |
| The number of harmonics that should be measured. |
| If only the even, odd or both (even and odd) harmonics should be measured. |
| On which power levelling point the desired testlevel should be regulated. |
| In the test site window the test engineer can select which equipment list will be used during this test. |
| In the test engineer window, the test engineer can select their own name. The test engineer name will be stored by the test results |
| The amount of measurements that are measured on each harmonic to determine its power. The average of these measurements will be used as the power of the harmonic. |
| Starts the configured calibration. |
| Cancel the configured calibration. |
| Display the environment window. |
| Display the note window. |
| Display the Units configuration window |
The harmonics calibration will step through the configured frequency range with the specified frequency step. On each of those tested frequencies, the calibration routine will regulate the output power of the amplifier to the specified power level on the forward powermeter, and will then measure the harmonics of that frequency.
Depending on the selected equipment different amplifier harmonic measurements can be performed:
- If a sensor powermeter is present in the selected testsite, the sensor powermeter will be used to measure the power of the harmonic. The sensor powermeter should in this case be connected to the coupler at the output of the amplifier. Often a frequency selective powermeter (like a spectrum analyzer) is used as the sensor powermeter. This setup allows to see the difference between the broadband output power of the amplifier compared to the actual output power of the CW frequency (the 1st harmonic) out of the amplifier.
- If no sensor powermeter is present in the selected testsite, the spectrum analyzer will be used to measure the power of the harmonic. The spectrum analyzer should in this case be connected to the calibration antenna and optionally the preamplifier. This setup allows to perform a calibration of the electrical field strength harmonics, also taking the frequency dependant antenna gain of the transmit antenna into account.
- If no sensor powermeter and no spectrum analyzer are selected, the forward powermeter will be used to measure the power of the harmonic. The forward powermeter should in this case be connected to the coupler at the ouput of the amplifier. A frequency selective powermeter (like a spectrum analyzer) should be used in this setup to correctly perform the amplifier harmonic calibration.
The measurement of the harmonic will also use the correction that is selected by the corresponding cables that are selected in the testsite.
The option that is selected at Type of harmonic and the number that is specified for Amount determine which harmonics are measured.
| Type of harmonic | Amount | Measured harmonics | CW Frequency | Measured harmonic frequencies |
|---|---|---|---|---|
| Both | 4 | 1, 2, 3, 4, 5 | 100 MHz | 100, 200, 300, 400 and 500 MHz |
| Even | 3 | 1, 2, 4, 6 | 600 MHz | 600 MHz, 1.2, 2.4 and 3.6 GHz |
| Odd | 2 | 1, 3, 5 | 1.5 GHz | 1.5, 4.5 and 7.5 GHz |
The 1st harmonic (which is the same as the generated CW signal) is always measured to ensure that the gain of the harmonics can be compared to the 1st harmonic.
Reviewing measurement data[edit]
In the results overview of the amplifier harmonics EUT calibration the following measurement values are available in the graph and the table:
| The power of the signal generator that is driving the amplifier. |
| The (broadband) output power that is generated by the amplifier. |
| The power of the first harmonic (the actual CW frequency) that is generated by the amplifier. |
| The power of specified harmonic that is generated by the amplifier. |
| The dBc difference between the specified harmonic and the first harmonic. |
| The standard deviation of the measured power samples of the specified harmonic. |
All the values of the harmonics are shown relative to the applied CW frequency that was generated by the signal generator when the harmonic was measured. If for example a CW frequency of 500 MHz is generated, the power value of the 3rd harmonic is also shown in the table at 500 MHz, even though it was actually measured on 1500 MHz. Showing the measured values of the harmonics on the same frequency as the CW frequency simplifies the comparison of the values between the harmonics and the value of the 1st harmonic itself.
It is possible that one or more of the higher harmonics have not been measured due to limitations of the allowed frequency range of the used equipment (which can be powermeter, coupler, spectrum analyzer, antenna and cables). For a CW frequency of 500 MHz, the 5th harmonic is generated at 2500 MHz. If however the used spectrum analyzer is only able to measure up to 2000 MHz, it is not possible to measure the 5th harmonic of 500 MHz, and thus the value in the table will be empty. Also the graphline of the 5th harmonic will then only be drawn up to 400 MHz, which corresponds to the 5th harmonic at 2000 MHz, which is the highest measurable frequency of that spectrum analyzer.
EUT S-Parameter[edit]
Before an EUT S-Parameter test can be performed, the network analyser needs to be calibrated. After calibrating the network analyser, there is a possibility to save the measured calibration into a calibration file which should be selected and used in this test.
To open the configuration of a calibration, as shown below, make sure the correct EUT window is open. Then select from the menu:
-
 Calibration
-
 EUT Calibration
-
 S Parameter
-
-
-
Select the previously created calibration file and configure the settings.
| Select the type of measurement, S11, S12, S21 and/or S22. |
| Sets the test level to use. |
| Sets the number of sweeps to use. |
| Sets the number of angles to use. |
| Sets the test-site to use. |
| Sets the engineer which is performing the test. |
Press Start Test to perform the S-Parameter test.
Reviewing measurement data[edit]
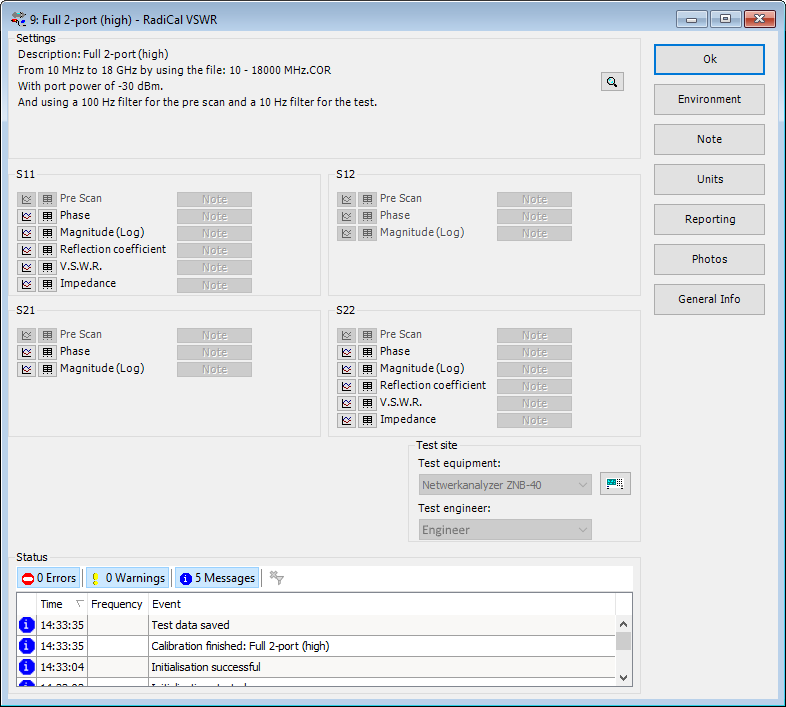
The test results of the S-Parameter test can be opened from the list of performed tests from the EUT window.
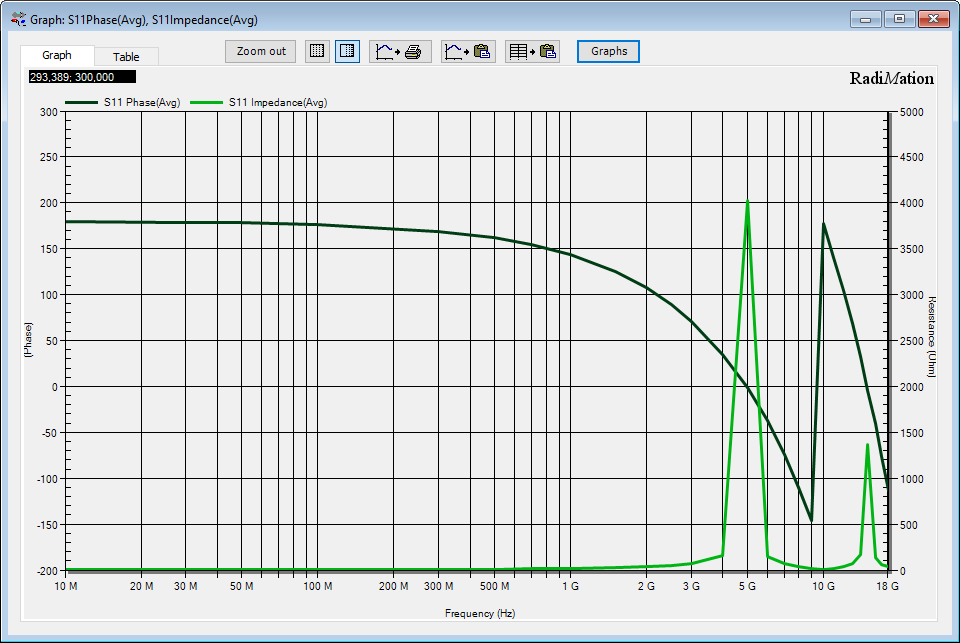
The specific test result of interest, either in graph or tabular format, can be opened by clicking the corresponding button in front of the measurement name. It is possible to show more results in one graph by clicking the Graphs button and selecting the measurement data.
